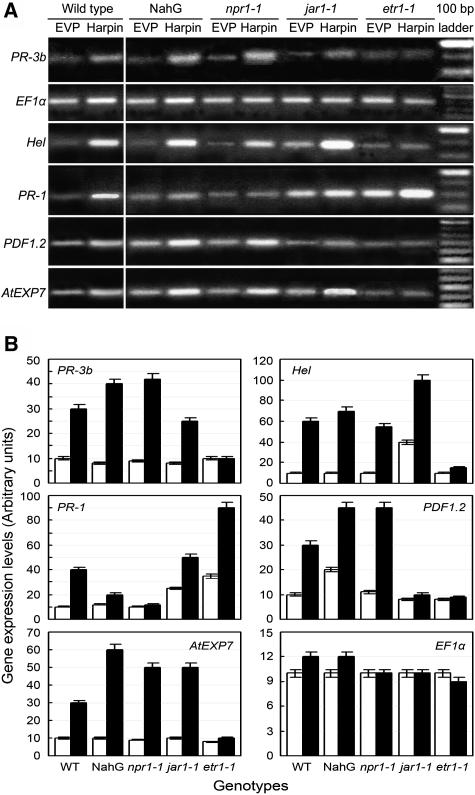
Figure 4.
Effects of Arabidopsis genotypes on expression of several effector genes in SA, ET, and JA signaling in response to harpin. A, Gel patterns of gene expression. B, Relative levels of gene expression. RT-PCR was conducted with RNA isolated at 3 dpt from untreated upper leaves of plants that had been sprayed on lower leaves with EVP or harpin. In gel photos, the brightest band of the 100-bp ladder is 600 bp. Gene expression levels are presented as white and black bars, respectively, for treatments with EVP (control) and harpin. For each gene, the arbitrary units were determined by verification based on defining the expression level in controls as 10. Data are given as means ± sd from three replicates.

