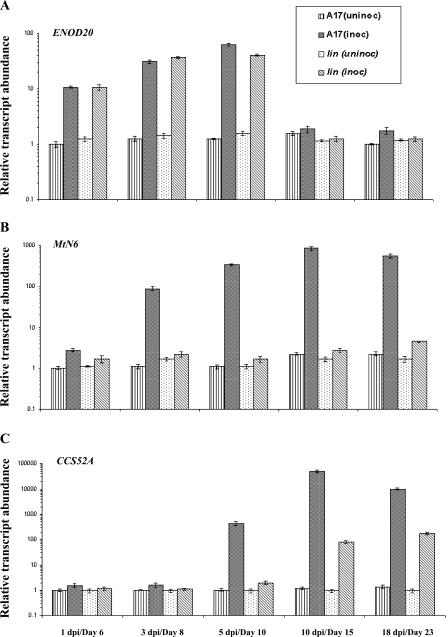
Figure 5.
Relative transcript abundance of marker genes for primordium development in wild-type and lin roots. A to C, Relative transcript abundance of ENOD20 (A), MtN6 (B), and CCS52A (C) in root samples of A17 and lin over a time course (x axes) with and without inoculation with rhizobia. Lined bars represent uninoculated root tissue of A17; black hatched bars represent inoculated root samples of A17; spotted bars represent uninfected samples of lin; and gray hatched bars represent infected root samples of lin. Transcript abundance (y axes) for all samples was estimated relative to A17 uninoculated roots on day 6. Each point represents the mean of three or four replicates with error bars representing the sd. Note that the y axis is in logarithmic scale and the scale is different for each gene. Uninoculated samples are indicated in terms of their physiological age in days and infected samples are indicated in dpi; for each time point, uninoculated and inoculated samples were harvested at the same age.

