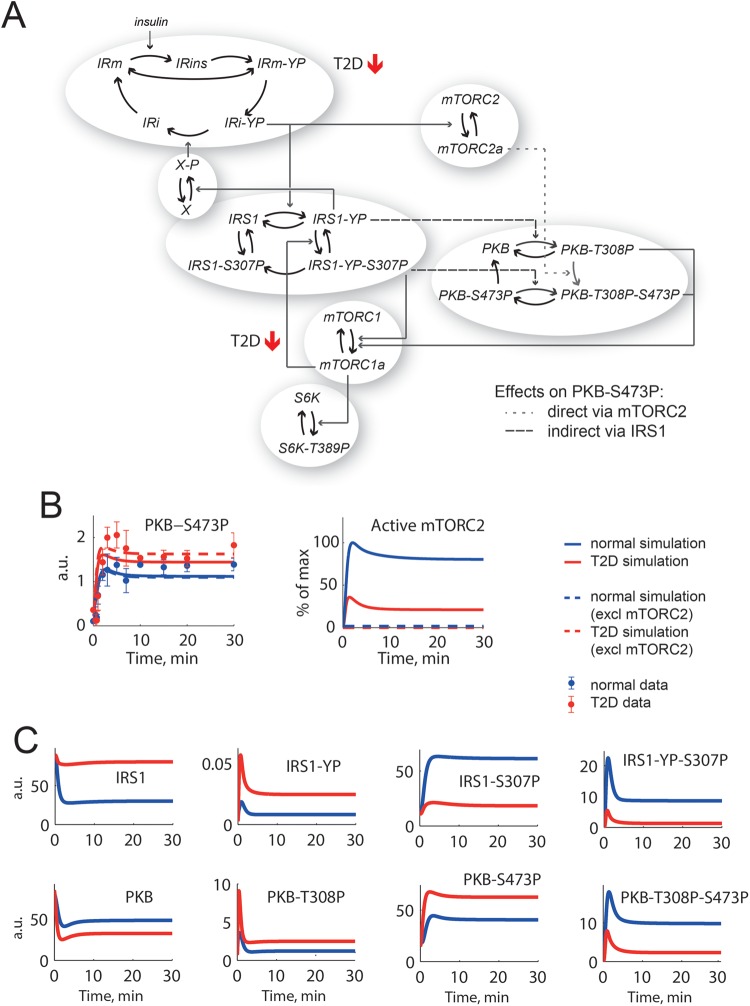
Figure 2. A core model of insulin signalling in human adipocytes can be forced to simulate PKB-S473P in the diabetic state, but with unacceptable consequences.
(A) The diabetes model from [1,2] reduced to a core network with IR, IRS1, PKB, mTORC1 and mTORC2, p70 S6K and a negative feedback to IR via an unknown protein X [19 ]. The insulin resistance is induced in this model by changing two parameters: total amount of IR is down to 55% and the feedback from mTORC1 to IRS1 is attenuated (marked with red arrows). Marked with a dotted line is the direct effect from mTORC2 to PKB-S473P and with dashed lines are the indirect effects from IRS1 that affects PKB-S473P. (B) To the left, data from primary human adipocytes for PKB-S473P in response to insulin normally (blue dots ± S.E.M.) and in diabetes (red dots ± S.E.M.) compared with corresponding model simulations (lines). To the right, the corresponding simulations for mTORC2 (lines). Simulations are chosen for best possible fit with PKB-S473P and acceptable fit with other data. The direct effect from mTORC2 to PKB-S473P is nearly absent, which becomes obvious when mTORC2 is completely inhibited in the model (dashed lines). (C) Simulations of the individual states of IRS1 and PKB reveal that single phosphorylated IRS1-YP and PKB-T308P have a higher response in diabetes (red) than normal (blue), but total IRS1-YP and PKB-T308P have a lower response in diabetes since the double phosphorylated states (IRS1-YP-S307P and PKB-T308P-S473P) are dominating.

