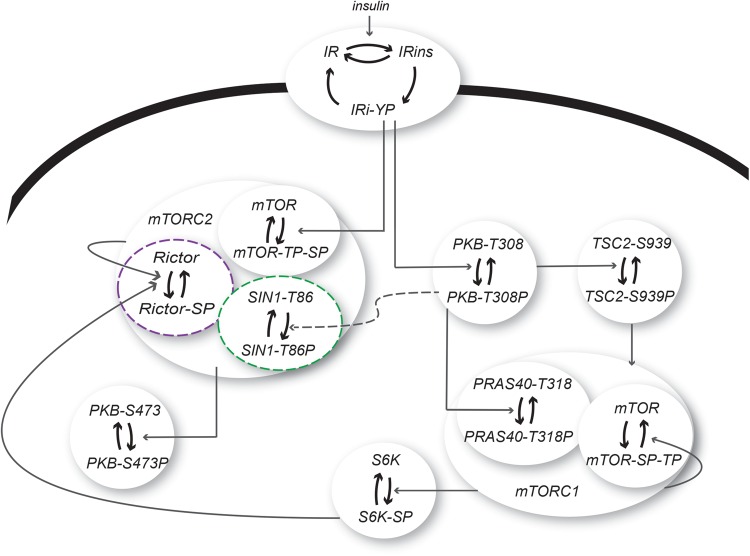
Figure 3. A dynamic mathematical model of mTORC-signalling in 3T3-L1 adipocytes.
A model for insulin signalling in 3T3-L1 adipocytes with the following proteins: IR that can be phosphorylated at tyrosine residues (Y) and internalized in response to insulin, PKB that can be phosphorylated both on T308 and S473, TSC2, S6K and the protein complexes mTORC1 (with the proteins PRAS40 and mTOR included) and mTORC2 (with the proteins mTOR, rictor and SIN1 included). The tested cross-talk signals to mTORC2 are marked in green (PKB → SIN1) and purple (S6K → rictor). The complete model structure can be found in the Supplementary material.

