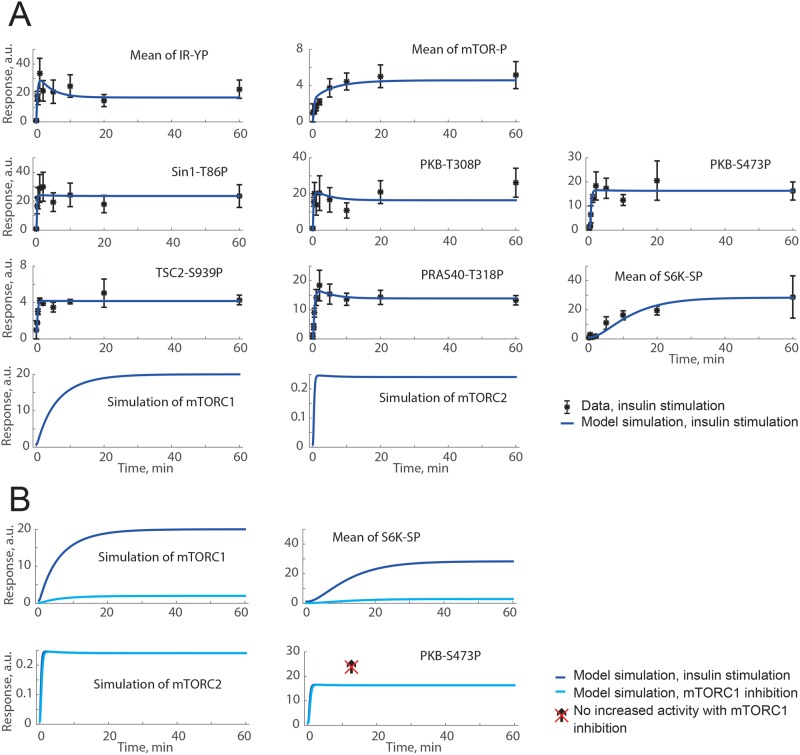
Figure 4. Both a positive and a negative signal from PKB to SIN1-T86P can explain time-course data, but not the increase in PKB-S473P under inhibition of mTORC1 with rapamycin.
(A) Model simulations of insulin stimulation (blue lines) are in agreement with extracted data from [11] (black dots ± S.E.M.). (B) Model simulations for insulin stimulation (blue lines) compared with model simulation of mTORC1 inhibition with rapamycin (cyan lines). The crossed over arrow indicates that an increase in PKB-S473P with mTORC1-inhibition is not possible to achieve with this model structure since no signals from mTORC1 to PKB-S473P are included. Shown are the model simulations for a positive signal from PKB to SIN1-T86P. Model simulations with a negative signal were similar (not shown).

