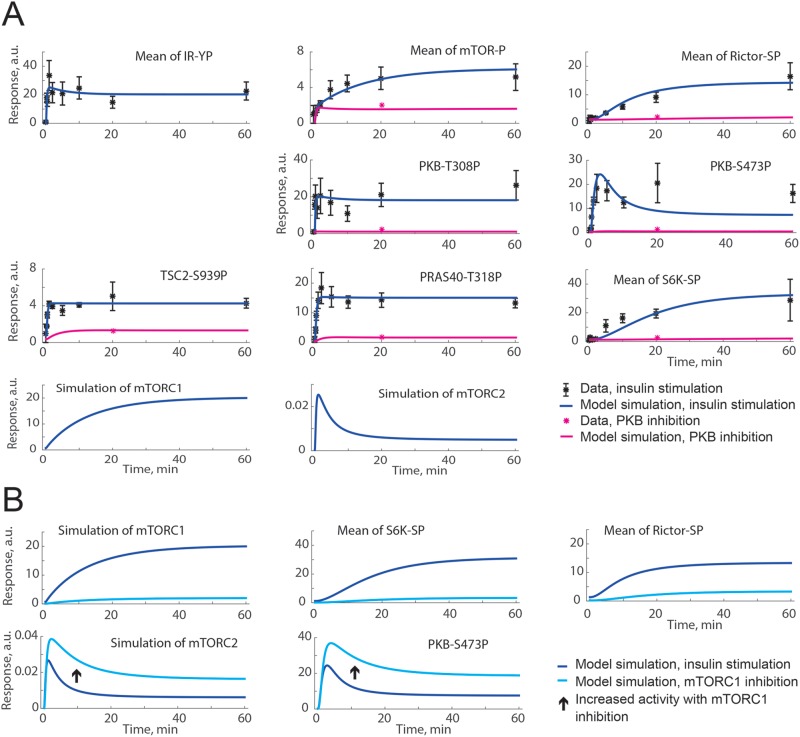
Figure 5. A negative signal from S6K to rictor can explain both time-course data and an increase in PKB-S473P under inhibition of mTORC1.
(A) Model simulations of insulin stimulation (blue lines) are in agreement with extracted data from [11] (black dots ± S.E.M.). Also shown is the agreement between model simulations of PKB inhibition (implemented as reduced PKB activation; pink lines) and corresponding data from [11] (pink dots) using MK2206 to inhibit PKB. (B) Model simulations for insulin stimulation (blue lines) compared with model simulation of mTORC1 inhibition (cyan lines). The arrow shows the simulated increase in mTORC2 activity and PKB-S473P with inhibition of mTORC1.

