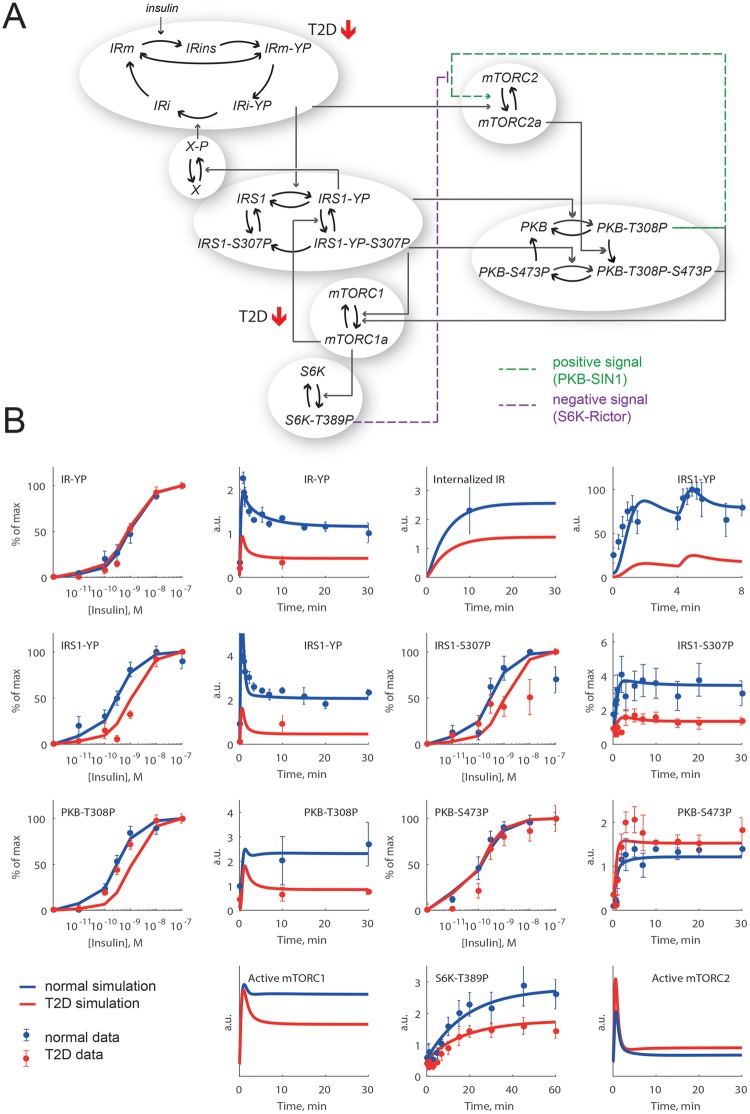
Figure 6. Implementation of combined positive and negative inputs to mTORC2 is required in the human adipocyte model to give a better fit to PKB-S473P data in the diabetic state.
(A) The new diabetes model structure with two branches of signalling downstream IR: IRS1 → S6K that is reduced in diabetes and mTORC2 → PKB-S473P that is increased in diabetes. The model structure includes a positive signal via IRS1-S307P, a negative signal from PKB-S473P to IR and the diabetes parameters from [1] (red arrows). The combined positive (purple dashed arrow) and negative (green dashed arrow) inputs to mTORC2 are the new parts of the model structure. (B) Model simulations of the normal (blue lines) and diabetic (red lines) responses to insulin, compared with data (dots ± S.E.M.) from human adipocytes.

