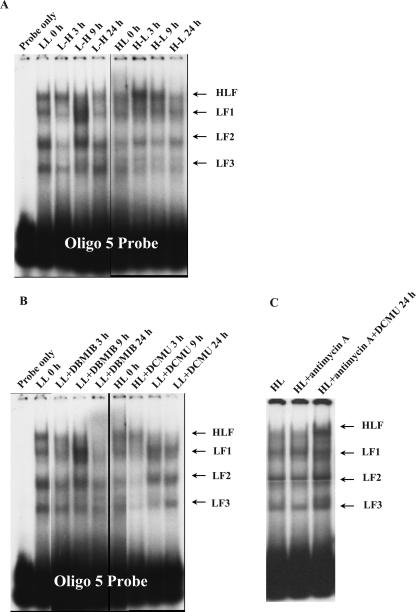
Figure 10.
EMSA of time course changes of DNA-binding activities in −247 to −218-bp region of Lhcb1 promoter following the light transitions (A), additions of PET inhibitors (B), and antimycin A with or without the presence of DCMU (C). All protein samples were subjected to a single-step ammonium sulfate precipitation at 50% saturation level. LL 0 h, LL-acclimated culture prior to the light transition; L-H, LL culture transferred to HL condition; HL 0 h, HL-acclimated culture prior to light transition; H-L, HL culture transferred to LL conditions; LL+DBMIB, LL culture treated with 1.5 μm DBMIB; HL+DCMU, HL culture treated with 200 nm DCMU; HL+antimycin A, HL culture treated with 1 μm antimycin A for 8 h; HL+antimycin A and DCMU, HL culture treated with 1 μm of antimycin A and 200 nm of DCMU for 8 h.

