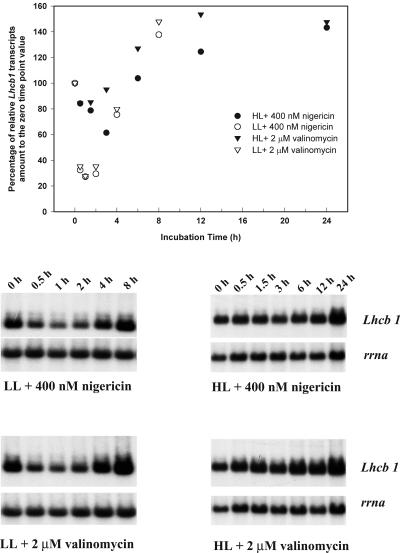
Figure 5.
Time course changes in Lhcb1 and rrna transcript levels in LL- and HL-acclimated cells following additions of 400 nm nigericin or 2 μm valinomycin. Top, Densitometric analysis of the time course changes in Lhcb1 level, normalized to rrna level, as percentage to the zero time point value. Bottom, Northern-blot analysis of total cellular RNA probed sequentially with Lhcb1 and rrna.

