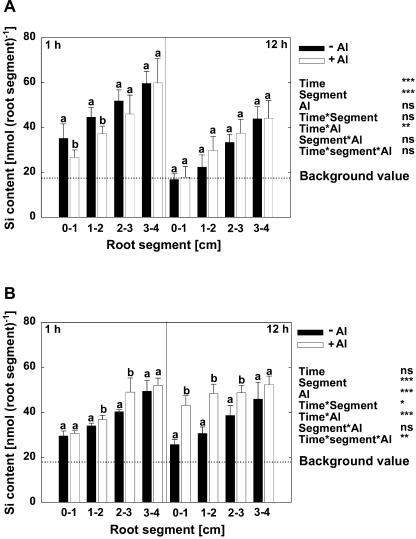
Figure 3.
Si contents of root segments of maize cv Lixis as affected by Si and Al supply grown in a solution containing 500 μm CaCl2 and 8 μm H3BO3, pH 4.3. Plants were precultured for 36 h without or with 1.4 mm Si and then treated without or with 25 μm Al for 1 h or 12 h in the absence (A) or presence (B) of 1.4 mm Si. The background value (dashed line) presents the mean Si content of the root segments without Si treatment. Bars show sd. Significant differences between mean values are indicated by different letters at the P < 0.05 level (Tukey test), n = 5. *, **, and ***, Significance at the P < 0.05, 0.01, and 0.001 levels according to the F test. ns, Not significant.

