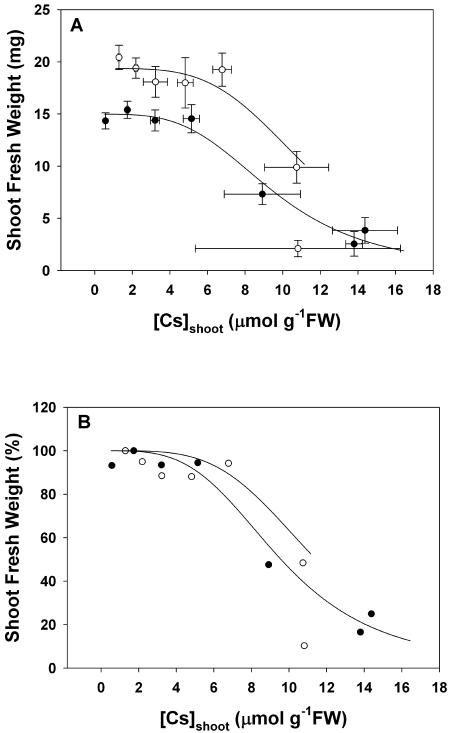
Figure 6.
The relationships between shoot FW versus the Cs concentration in the shoot ([Cs]shoot; A) and between shoot FW, expressed as a percentage of the value obtained in the absence of [Cs]agar, versus [Cs]shoot (B) for Arabidopsis accession Ws2 grown for 21 d on mineral-replete agar containing between 0.0003 and 10 mm Cs and 2 mm (•) or 20 mm (○) K. All data represent means ± se from at least three replicate experiments. The line represents the relationship between shoot FW and [Cs]shoot derived from the logistic sigmoidal curve fitted to the relationships between shoot FW versus [Cs]agar (Fig. 2) and the linear regression fitted to the relationships between [Cs]shoot versus [Cs]agar (Fig. 3). Parameters for all fitted equations are given in Table I. Data for [Cs]shoot of plants with shoot FW less than 10% of the maximal were not plotted.

