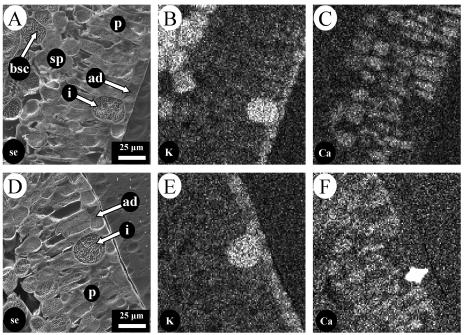
Figure 2.
Distribution of potassium and calcium in different cell types in the adaxial half of a leaf from rough lemon grown in unamended nutrient solution. A and D, Secondary electron images; B and E, potassium distribution; C and F, calcium distribution. A to C and D to F are from different leaves. ad, Adaxial epidermis; bsc, bundle sheath cell; i, idioblast cell; p, palisade mesophyll; sp, spongy mesophyll.

