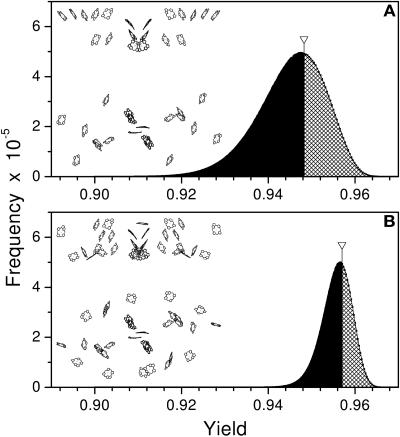
Figure 3.
Histograms of the Quantum Yield Distributions Computed for Models of the Antenna Systems.
(A) Green sulfur bacteria C. lumicola.
(B) Heliobacteria H. mobilis.
The orientations of all antenna chlorophyll included in each model were varied. Inserts show the structure of the respective models. Arrows indicate the location of the quantum yield calculated with native chlorophyll orientations as found in the x-ray structures. Areas under the shadowed/black parts of the histograms represent the number of alternative pigment orientations with yields higher/lower than the native x-ray structure, respectively.

