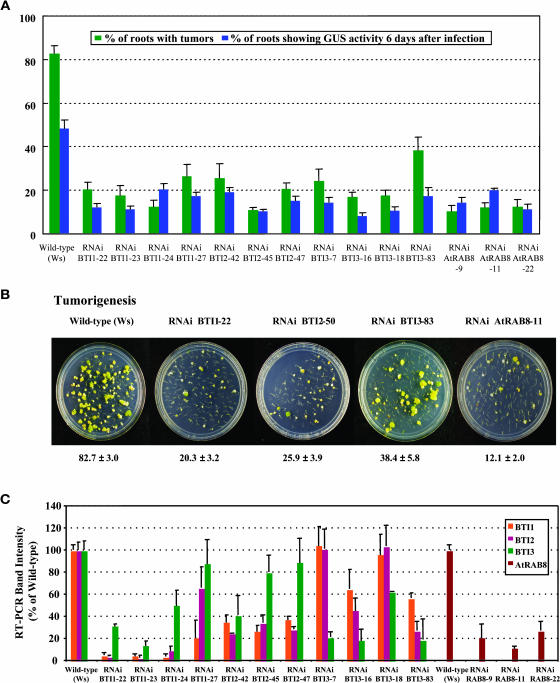
Figure 7.
Transgenic BTI and AtRAB8 RNAi Plants Show Reduced Susceptibility to Agrobacterium-Mediated Root Transformation.
(A) T2 generation BTI1, BTI2, BTI3, and AtRAB8 RNAi transgenic plants show lower stable and transient transformation efficiencies compared with wild-type plants. Green bars represent the stable transformation efficiency. The root segments were infected with the tumorigenic strain Agrobacterium A208. Blue bars represent the percentage of root segments showing GUS activity 6 d after infection with Agrobacterium At849. At least 20 independent plants were tested for each transgenic line and >80 root segments were examined for each plant. Error bars = se.
(B) Representative plates of transgenic BTI and AtRAB8 RNAi plants showing resistance to tumor formation. The numbers below each plate indicate the average stable transformation efficiency ±se.
(C) Transgenic BTI RNAi plants show reduced levels of BTI transcripts. Transgenic AtRAB8 RNAi plants show reduced levels of AtRAB8 transcripts. Transcript levels of each BTI gene and AtRAB8 in RNAi transgenic plants are shown as a relative percentage of that of wild-type plants. Data are shown as average values of two RT-PCR reactions from three T2 generation plants of each line. Note that RNAi BTI1, BTI2, and BTI3 plants preferentially show a reduced level of transcripts targeted by the specific construction, whereas other BTI transcripts are reduced to a lesser extent. Error bars = se.

