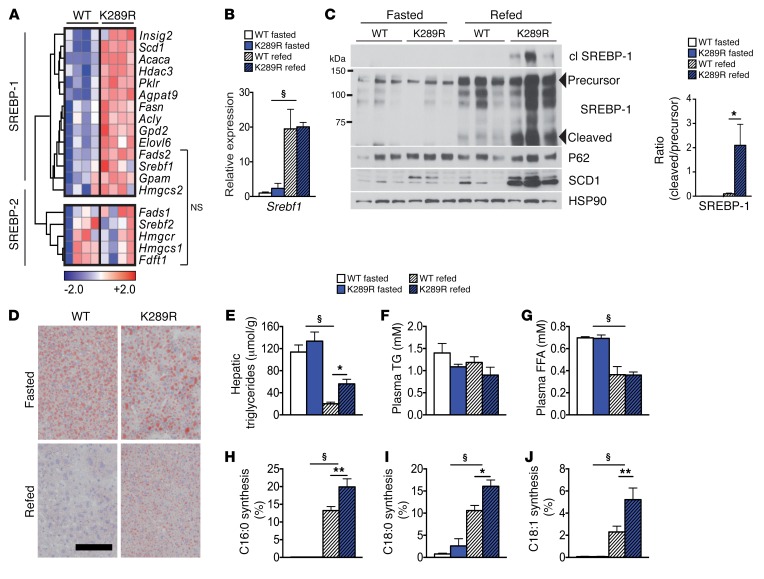
Figure 1. LRH-1 K289R mice display increased de novo lipogenesis.
(A) Heat map showing the expression of genes involved in de novo fatty acid and cholesterol synthesis in refed WT and K289R mice. Normalized expression values are in log2 scale. SREBP-1, depicting mainly SREBP-1 target genes; SREBP-2, mostly SREBP-2 target genes; NS, transcripts that are not significantly changed between the indicated genotypes. For all other transcripts P < 0.05. (B) Hepatic mRNA expression of Srebf1 in K289R and WT mice. n = 10 per genotype. (C) Left, immunoblots of precursor and cleaved (cl) SREBP-1, SCD1, HSP90, and P62 in hepatic lysates of WT or K289R livers. Right, graph displaying the ratio of cleaved to precursor SREBP-1. (D) Representative images of liver sections of K289R or WT mice stained with oil red O to visualize neutral lipids. Scale bar: 200 μm. (E) Quantification of hepatic triglyceride content in WT and K289R mice. n = 10 per group. (F and G) Plasma triglyceride (TG) and free fatty acid (FFA) contents in WT and K289R mice. n = 10 per group. (H–J) Fractional de novo synthesis rates of palmitate (H), stearate (I), and oleate (J) in WT and K289R mice. n = 6 per group. Error bars represent mean ± SEM. *P < 0.05, **P < 0.01 relative to WT within each nutritional state; §P < 0.001 refed relative to fasted mice, as determined by unpaired Student’s t test (A) or 2-way ANOVA with Bonferroni’s post-hoc test (B, C, E–J). WT, LRH-1 WT; K289R, LRH-1 K289R mice.

