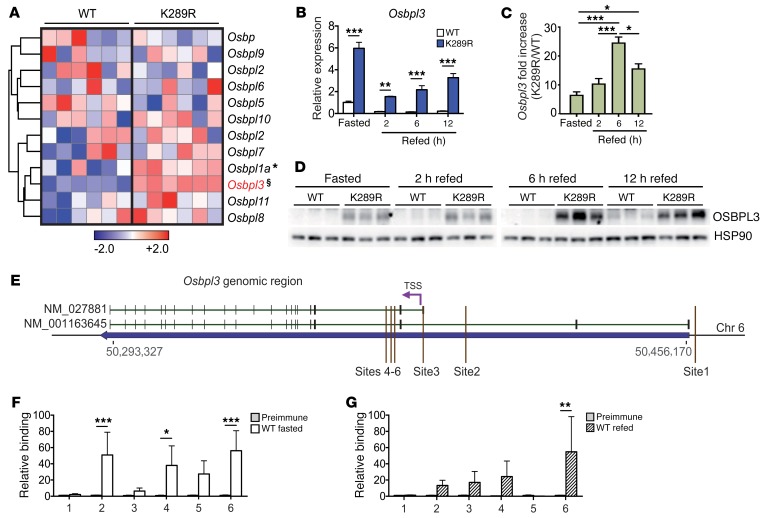
Figure 2. Osbpl3 is a direct LRH-1 target gene and overexpressed in LRH-1 K289R mice.
(A) Heat map showing the hepatic expression of oxysterol-binding protein family members in WT and K289R mice. Normalized expression values are in log2 scale. (B and C) Expression of Osbpl3 mRNA in hepatic lysates of fasted and refed WT and K289R mice (B) and the fold change between the genotypes (C). n = 4 per fasted, 2-hour–, or 12-hour–refed groups, and n = 5 per 6-hour–refed groups. (D) Expression levels of OSBPL3 protein in hepatic lysates of fasted and refed WT and K289R mice. (E) Schematic showing the genomic area containing the Osbpl3 gene and the sites used for ChIP-qPCR experiments (mouse genome assembly mm10). (F and G) Binding of LRH-1 to the different Osbpl3 promoter sites assessed by ChIP analysis using genomic DNA from fasted WT (F) and refed WT livers (G). n = 5 WT fasted, n = 5 WT refed. Error bars represent mean ± SEM. *P < 0.05, **P < 0.01, ***P < 0.001, §P = 2 × 10⁻⁷ relative to WT, as determined by unpaired Student’s t test (A), or 1-way (C) or 2-way (B, F, G) ANOVA with Bonferroni post-hoc test. TSS, transcription start site.

