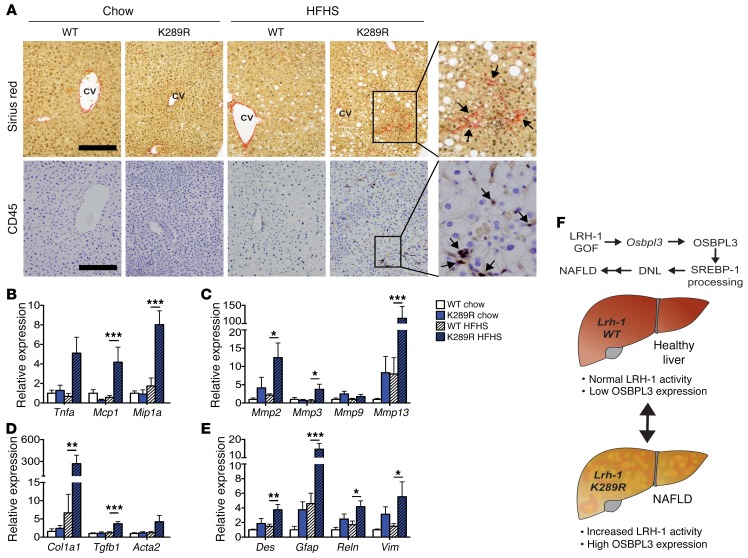
Figure 5. LRH-1 K289R mice display increased inflammation and early signs of fibrosis upon HFHS diet feeding.
(A) Representative images of liver sections of K289R or WT mice stained with sirius red or CD45 to visualize collagen depositions and CD45-positive cells, respectively. Scale bars: 200 μm. CV, central vein. (B–E) Hepatic mRNA expression of genes involved in inflammation (B), matrix degradation (C), fibrosis (D), and stellate cells (E) in K289R and WT mice. n = 9 per genotype. (F) Graphical presentation showing how the LRH-1/OSBPL3 axis drives the accumulation of hepatic lipids. Error bars represent mean ± SEM. *P < 0.05, **P < 0.01, ***P < 0.001 relative to WT within each diet, as determined by 2-way ANOVA with Bonferroni’s post-hoc test (B–E).

