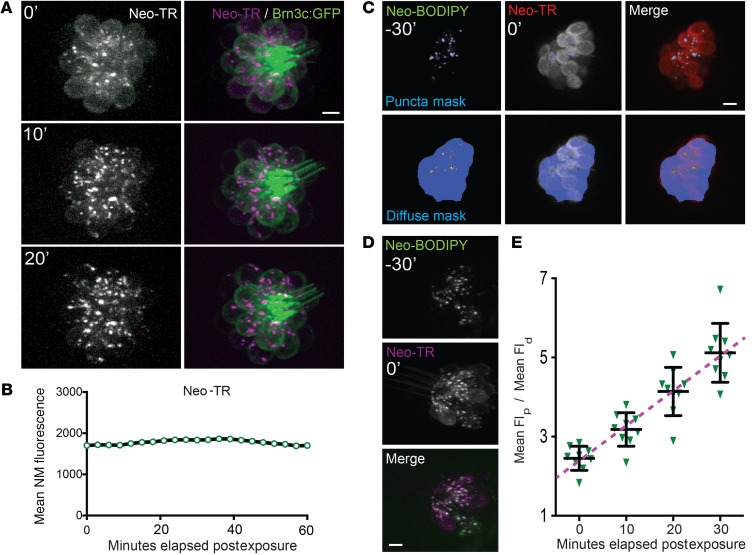
Figure 5. Labeled AGs transit from the diffuse intracellular pool into lysosomes.
(A) Time-lapse imaging of Neo-TR in pulse-labeled HCs shows a progressive accumulation of Neo-TR in puncta and loss of diffuse signal in the cytosol. Redistribution is apparent within 20 minutes of exposure. Scale bar: 5 μm. (See also Supplemental Video 4.) (B) Total intracellular Neo-TR fluorescence following pulse exposure does not decrease, indicating that loss of Neo-TR signal from the cytosol is likely due to redistribution to lysosomes and not export from cells. NM, neuromast. (C) An example of image masks (in blue) used to monitor the lysosomal and cytosolic fractions of Neo-TR. Image captured immediately after Neo-TR exposure. Scale bar: 5 μm. (D) Neo-TR added 30 minutes after Neo-BODIPY pulse exposure accumulates in the Neo-BODIPY–prelabeled structures. Image captured 10 minutes after Neo-TR exposure. Scale bar: 5 μm. (E) Quantification of loading into lysosomes following a Neo-TR pulse. After 30 minutes, intensity within the lysosomal mask is approximately 5-fold higher than intensity in the cytosol. Each graphed symbol represents 1 fish, 3 neuromasts per fish. Error bars: ± 1 SD. Flp, Fluorescence in puncta; Fld, diffuse fluorescence.

