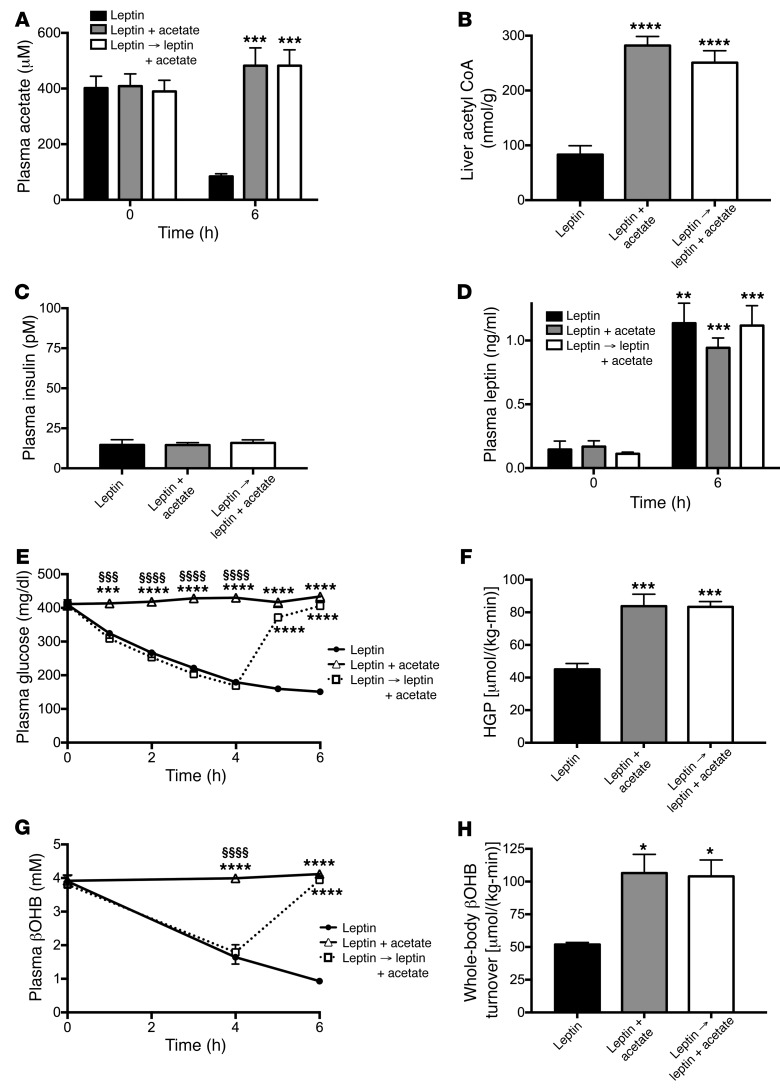
Figure 3. Suppression of hepatic acetyl CoA accounts for leptin’s ability to reverse DKA.
(A and B) Plasma acetate and liver acetyl CoA. (C and D) Plasma insulin and leptin. (E and F) Plasma glucose concentrations and HGP. (G and H) Plasma βOHB concentrations and whole-body βOHB turnover. In all panels, *P < 0.05, **P < 0.01, ***P < 0.001, ****P < 0.0001 vs. leptin-treated rats; §§§P < 0.001, §§§§P < 0.0001 vs. leptin plus acetate–treated rats. Data are the mean ± SEM of n = 6 (leptin), n = 7 (leptin plus acetate), and n = 7 (leptin → leptin plus acetate) per group, with data compared by ANOVA with Bonferroni’s multiple comparisons test. Arrow denotes rats that were treated with leptin alone for 4 hours, then infused with leptin plus acetate for the final 2 hours.

