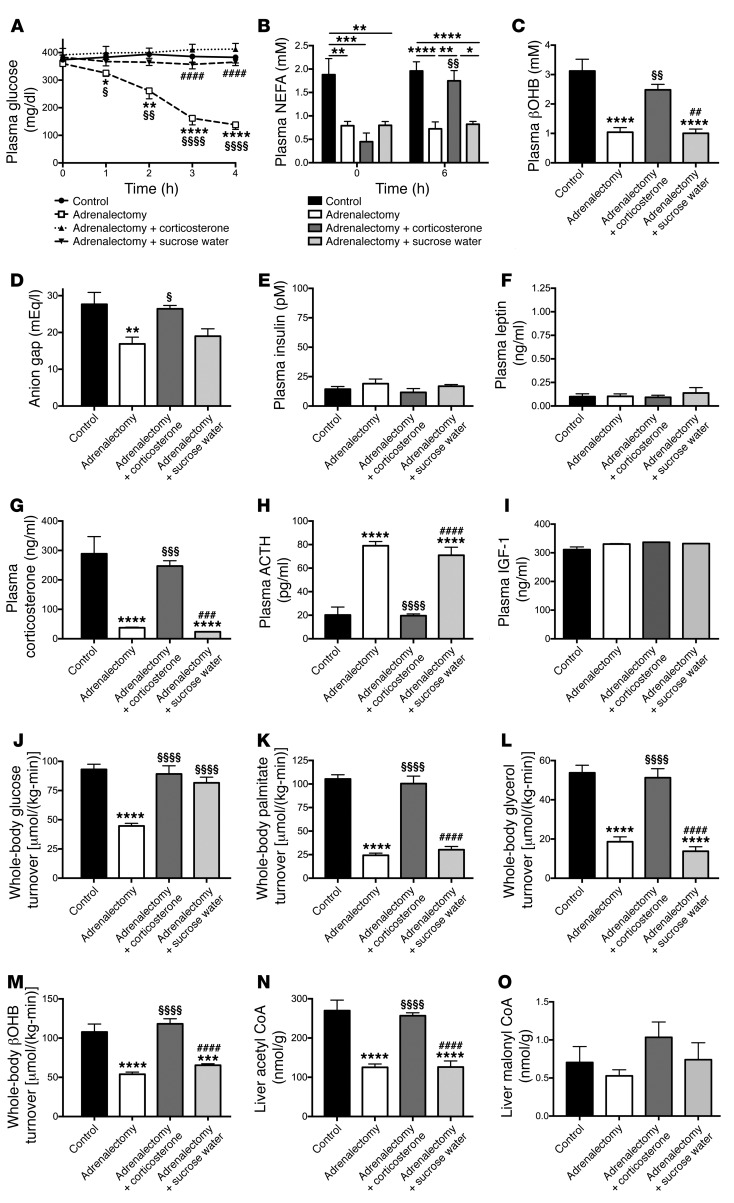
Figure 4. Hypercorticosteronemia drives DKA through increased lipolysis.
(A–C) Plasma glucose, NEFA, and βOHB concentrations in adrenalectomized T1D rats. In all panels, unless indicated otherwise, all measurements were made at the 4-hour time point. (B) *P < 0.05, **P < 0.01, ***P < 0.001, ****P < 0.0001 between the groups indicated; §§P < 0.01 vs. adrenalectomy plus corticosterone at time zero. (D) Anion gap. (E–I) Plasma insulin, leptin, corticosterone, ACTH, and IGF-1 concentrations. (J) Whole-body glucose turnover. (K–M) Whole-body palmitate, glycerol, and βOHB turnover. (N and O) Liver acetyl and malonyl CoA concentrations. In all panels, data are the mean ± SEM of n = 8 (control), n = 11 (adrenalectomy), n = 6 (adrenalectomy plus corticosterone), or n = 6 (adrenalectomy plus sucrose water) per group. Unless otherwise specified, *P < 0.05, **P < 0.01, ***P < 0.001, ****P < 0.0001 vs. controls; §P < 0.05, §§P < 0.01, §§§P < 0.001, §§§§P < 0.0001 vs. adrenalectomized rats; ##P < 0.01, ###P < 0.001, ####P < 0.0001 vs. adrenalectomy plus corticosterone–treated rats. Data were compared using ANOVA with Bonferroni’s multiple comparisons test.

