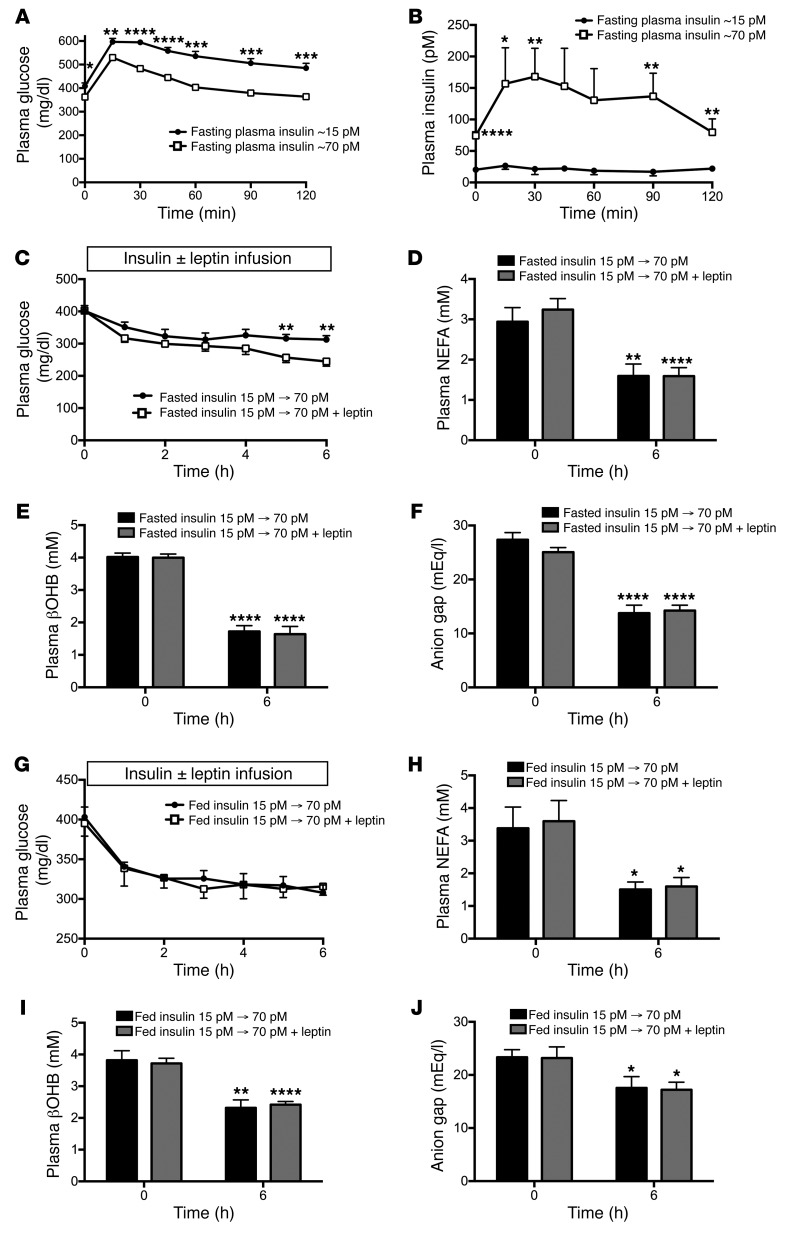
Figure 5. Insulin and feeding abrogate leptin’s effects to lower plasma glucose.
(A and B) Plasma glucose and insulin during a glucose tolerance test in T1D rats with fasting plasma insulin of approximately 15 pM as compared with those with fasting plasma insulin of approximately 70 pM. (C–F) Plasma glucose, NEFA, βOHB, and anion gap before and after an infusion of insulin to achieve plasma concentrations of approximately 70 pM. (G–J) Plasma glucose, NEFA, βOHB, and anion gap in fed rats with food withdrawn at the start of the study, before and after an infusion of insulin to achieve plasma concentrations of approximately 70 pM. (A–C, and G) *P < 0.05, **P < 0.01, ***P < 0.001, ****P < 0.0001 between groups by 2-tailed unpaired Student’s t test. (D–F and H–J) *P < 0.05, **P < 0.01, ****P < 0.0001 vs. the same group at time zero by 2-tailed paired Student’s t test. Data are the mean ± SEM of n = 6 per group (panels A–F) or n = 10 (fed, insulin 15 pM to 70 pM) and n = 11 (fed, insulin 15 pM to 70 pM + leptin) per group (panels G–J).

