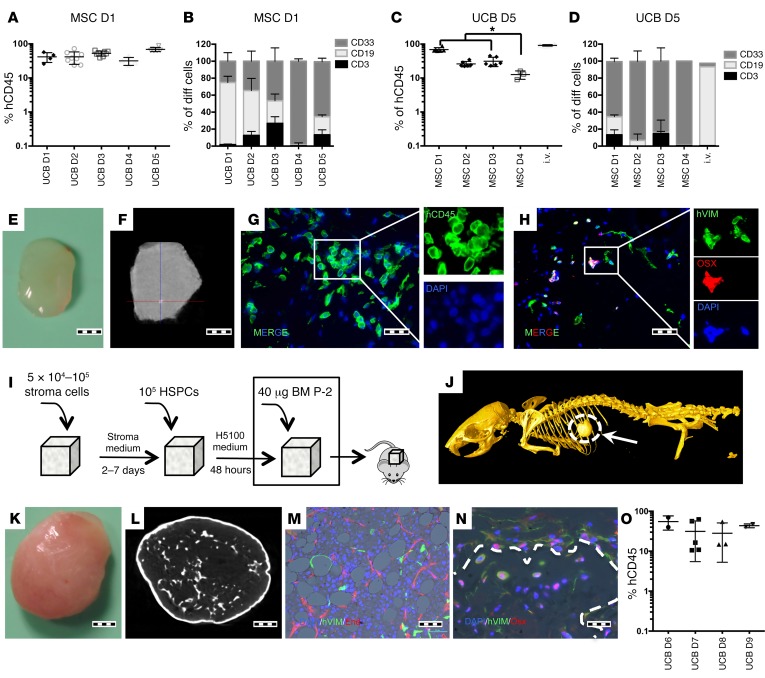
Figure 1. UCB-derived HSPC engraftment in s.c. scaffolds.
(A and B) Comparative assay using a single hMSC donor and multiple UCB donors. Each point represents 1 mouse seeded with 6 scaffolds. For each UCB donor, 3 to 8 mice were transplanted. (A) hCD45 scaffold-engraftment level. D1-D5: different UCB Donors. (B) Lineage distribution of engrafted cells. (C and D) A comparative assay using a single UCB donor and multiple hMSC donors. Each point represents 1 mouse seeded with 6 scaffolds. For each hMSC donor, 3 to 6 mice were transplanted. (C) hCD45 scaffold–engraftment levels. For comparative purposes, the engraftment levels in BM of i.v.-injected mice are provided. Tukey’s test for multiple comparisons was applied. *P < 0.05. (D) Lineage distribution of engrafted cells. (E) Gross morphology of harvested scaffold. (F) microCT study of a harvested scaffold. The scaffold is mainly soft tissue, with sporadic calcification spots. (G) Immunofluorescence image showing hCD45 cells in the scaffold and (H) osterix-positive (OSX+) and osterix-negative human stroma cells. (I) Schematic of preparation and implantation of bone-forming scaffolds. (J) Whole-mouse microCT showing the s.c. ossicle formation. (K) Gross morphology of the harvested ossicle. (L) microCT study of a harvested ossicle. (M and N) Immunofluorescence images showing (M) human vimentin+ (hVIM) mesenchymal cells and adipocytes and mature neovascularized (endomucin+, End) BM. (N) Trabecular bone formed inside ossicles. Dotted line shows delimited trabecular bone area. hVIM+/Osx+ cells are osteocytes or osteoblasts in the bone surface areas. (O) hCD45+ engraftment levels in the ossicle model tested with multiple UCB donors. Each point represents 1 mouse with 2 scaffolds. For each UCB donor, 2 to 4 mice were transplanted. Scale bars: 1 mm (E, F, K, and L); 20 μm (G, H and N); 50 μm (M). All data were harvested at 12 weeks after implantation.

