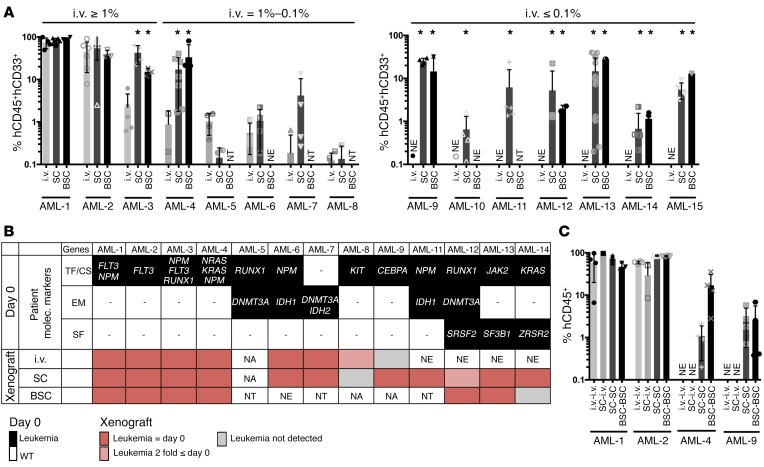
Figure 3. AML engraftment in different implantation models.
(A) Percentage of hCD45+hCD33+ cells recovered from each xenograft implantation model compared with conventional i.v. injection in NSG mice 12 weeks after transplant for patients classified as high engrafters (≥ 1% engraftment), low engrafters (between 1 to 0.1%), and nonengrafters (< 0.1%) using conventional i.v. injection. i.v., i.v. injection; SC, scaffold-implantation; BSC, bone scaffold-implantation. Comparison between i.v. and SC or BSC was applied using Dunnett’s test. *P < 0.05. Each point represents 1 mouse implanted with 2 to 6 scaffolds. For each patient, 2 to 8 mice were transplanted per condition. (B) Graphical representation of gene mutations detected in CD33+ pretransplant and hCD45+hCD33+ postxenografted cells. Mutations are grouped in transcription factor and cell signaling (TF/CS) genes, epigenetic modifier (EM) genes, and splicing factor (SF) genes. NA, sample not available for testing; NE, no engraftment was detected in mice; NT, not tested. Red boxes, variant allele frequencies comparable to day 0; pink boxes, ≤ 2-fold day 0; gray boxes, not detected. Variant allele frequencies for xenotransplanted samples are the average between ≥1, where applicable. (C) Percentage of hCD45+ cells recovered from secondary recipients. Primary cells from i.v. mice were transplanted i.v. into secondary mice (i.v.-i.v.). Primary cells from SC were transplanted i.v. (SC-i.v.) or implanted into scaffold (SC-SC) in secondary mice. Primary cells from BSC were implanted into BSC in secondary mice (BSC-BSC). Each point represents 1 mouse. For each patient, 2 to 4 mice were transplanted per condition.

