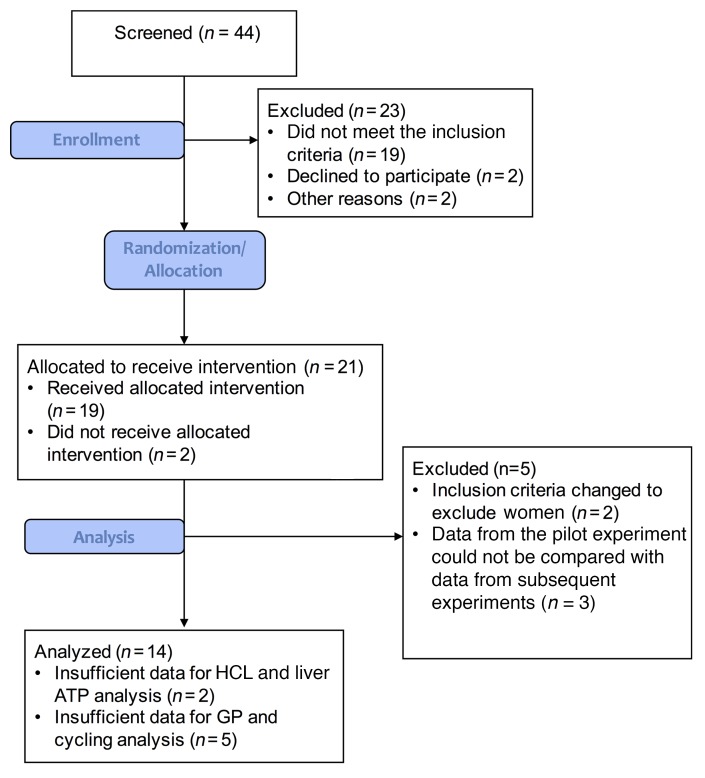
Figure 1. CONSORT flow diagram.
Forty-four patients underwent screening, which included a medical history, BMI analyses, and bioimpedance and an oral glucose tolerance tests. Of the 44 participants, 19 did not meet the inclusion criteria, 2 declined to participate, and 2 were excluded for other reasons. Twenty-one participants were allocated to receive the intervention, two of whom did not receive the allocated intervention. An additional 5 volunteers were excluded due to changes in inclusion and exclusion criteria (n = 2), as well as changes in the experimental procedure, which yielded data that could not be compared with subsequently acquired data (n = 3). Ultimately, data from 14 individuals were analyzed, except for hepatic lipid and energy analyses (n = 12) and some hepatic glucose flux measurements (n = 9).

