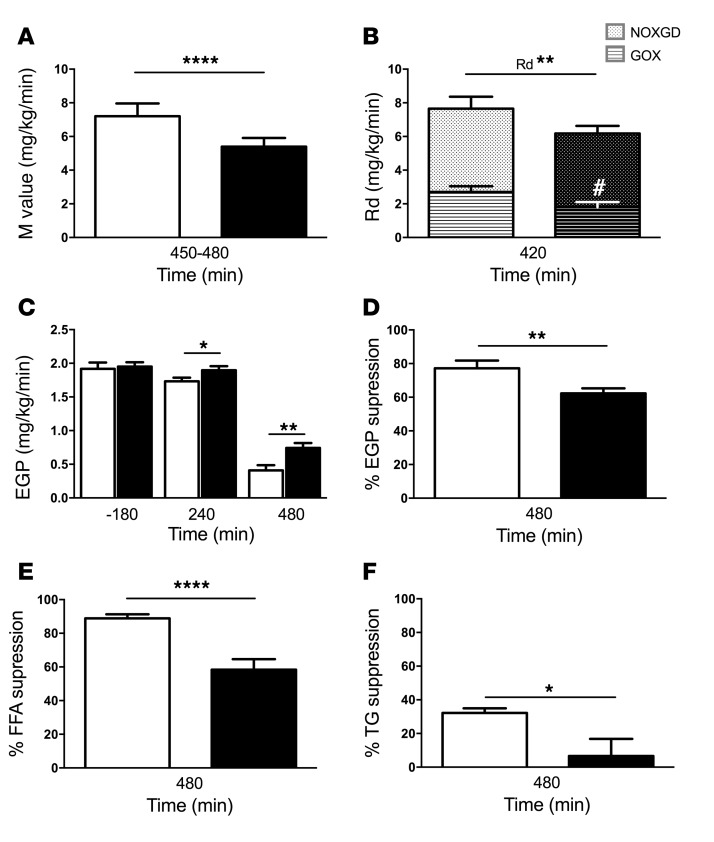
Figure 3. Parameters of insulin resistance in human volunteers after VCL or PO during clamp experiments.
VCL, white bars; PO, black bars. (A) WBIS, reflected by the M value. (B) Rd and its components GOX and nonoxidative glucose disposal (NOXGD). (C) EGP denoting hepatic insulin sensitivity at baseline (–180 min), after PO or VCL ingestion (240 min), and under insulin-stimulated conditions during the clamp (480 min). (D) Insulin-induced EGP suppression as an indicator of hepatic insulin sensitivity. (E) Insulin-induced FFA suppression reflecting adipose tissue insulin sensitivity and (F) the percentage of insulin-induced TG suppression. Data shown represent the mean ± SEM. n = 14. ****P = 0.0005, **P < 0.01, and *P < 0.05; #P < 0.05, for GOX PO versus VCL. P values were determined by 2-tailed t test and ANOVA.

