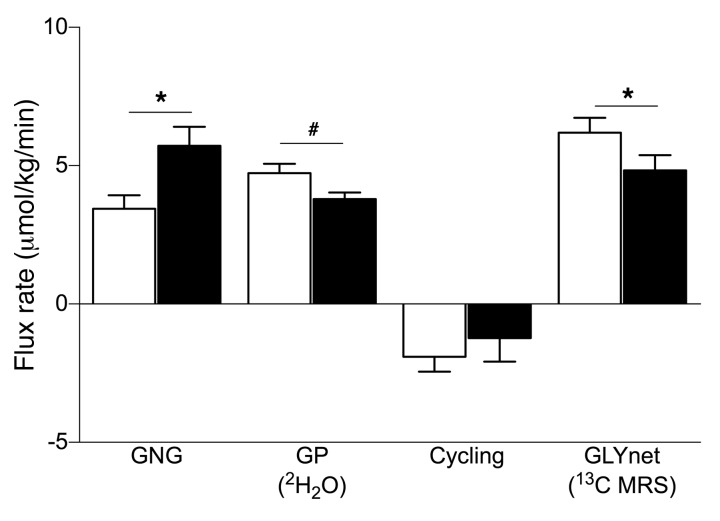
Figure 4. Hepatic glucose fluxes in humans.
The rates of GNG, GP flux, glycogen cycling (cycling), and GLYnet were analyzed using in vivo 13C/31P/1H and ex vivo 2H MRS combined with 2H2O ingestion, after either VCL (white bars) or PO (black bars) treatment, in lean, insulin-sensitive, male volunteers. Data represent the mean ± SEM. n = 14; GP and cycling n = 9. *P < 0.05 and #P = 0.085, by 2-tailed t test.

