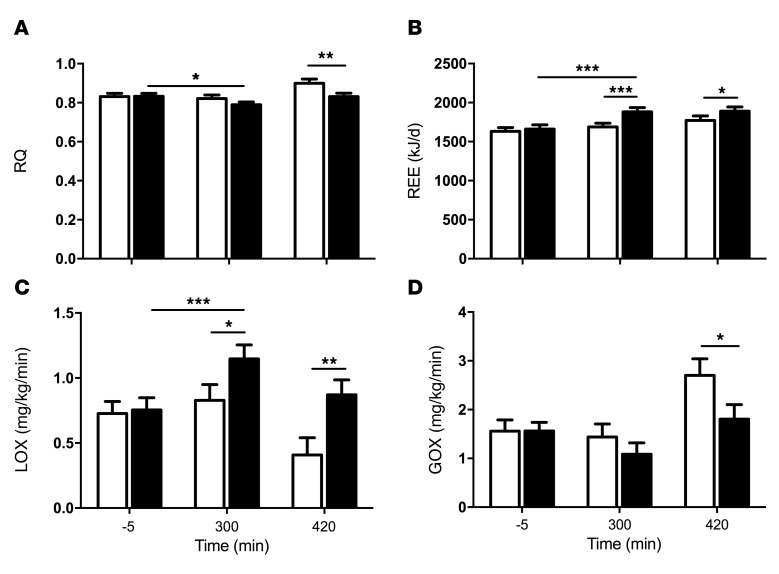
Figure 5. Time course of parameters of energy metabolism in lean, healthy volunteers after VCL and PO.
VCL, white bars; PO, black bars. Parameters were obtained by performing an indirect calorimetry. The time points indicated are basal (–5 min), 300 minutes after intervention, and 420 minutes under insulin-stimulated conditions. Effects on RQ (A), REE (B), LOX (C), and GOX (D). Data represent the mean ± SEM. n = 14. ***P < 0.001, **P < 0.005, and *P < 0.05, by ANOVA.

