Figure 4.
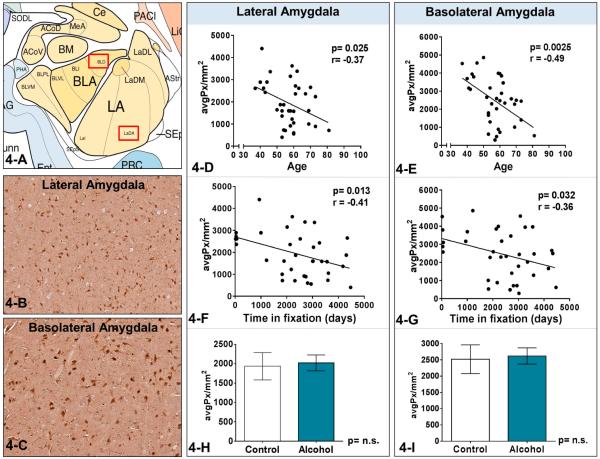
Figure 4-A is a schematic diagram of the amygdala in the coronal plane. Figures 4-B and C show representative photomicrographs (10X) of 3α,5α-THP immunostaining in the lateral and basolateral amygdala. The red boxes in Figure 4-A show the regions that are represented in the photos. Figure 4-D and 4-E indicate that 3α,5α-THP levels were negatively related to the age of subjects in lateral amygdala (Pearson's r value= −0.37, p=0.025, n=36) and basolateral amygdala (Pearson's r value= −0.49, p=0.0025, n=36). Figure 4-F and 4-G show that 3α,5α-THP levels were negatively related to the time in fixation of samples in lateral amygdala (Pearson's r value= −0.41, p=0.013, n=36) and basolateral amygdala (Pearson's r value= −0.36, p=0.032, n=36).

