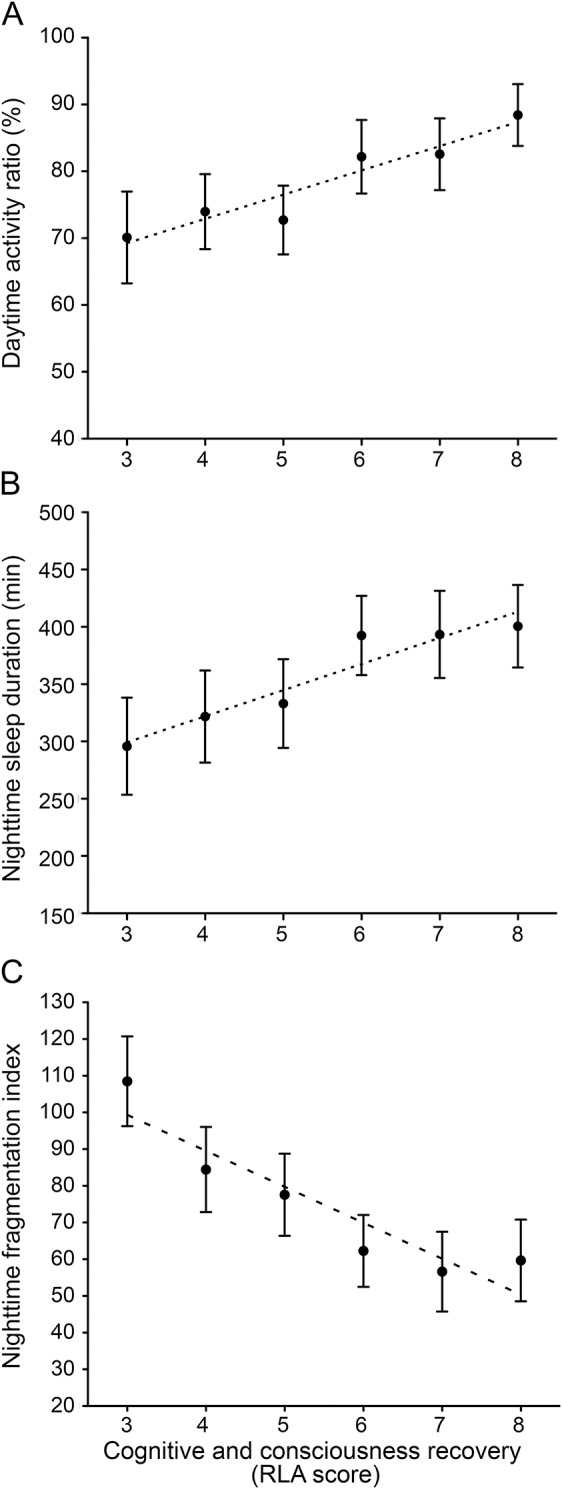
Figure 1. Association between cognitive and consciousness recovery and the sleep-wake cycle.

(A) Parallel evolution of the Rancho Los Amigos scale of cognitive functioning (RLA) score and daytime activity ratio in the 30 patients assessed over 233 days. Black dots indicate the mean daytime activity ratio per score on the RLA scale, generated within the mixed model equation, and black bars represent SEM. The linear contrast analysis was statistically significant (p < 0.001). (B) Parallel evolution of the RLA score and nighttime sleep duration. Black dots indicate the mean nighttime sleep duration (minutes) per score on the RLA scale, generated within the mixed model equation, and black bars represent SEM. The linear contrast analysis was statistically significant (p = 0.002). (C) Parallel evolution of RLA score and nighttime fragmentation index. Black dots indicate the mean nighttime fragmentation index per score on the RLA scale, generated within the mixed model equation, and black bars represent SEM. The linear contrast analysis was statistically significant (p < 0.001).
