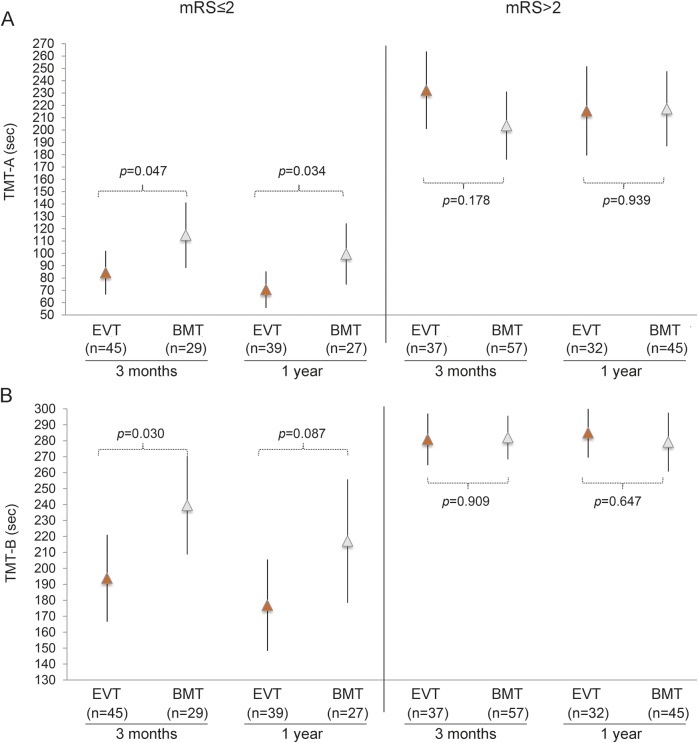
Figure 2. TMT-A (A) and TMT-B (B) completion times stratified by functional outcome (mRS score ≤2 and >2) in both treatment arms.
Vertical axis represents completion times (seconds). Arrows and lines represent mean and 95% confidence interval of the mean. Gray arrows indicate endovascular treatment (EVT); white arrows indicate best medical treatment (BMT). p Value represents unadjusted mean difference (linear regression analysis) between treatment arms. mRS = modified Rankin Scale. TMT = Trail Making Test.

