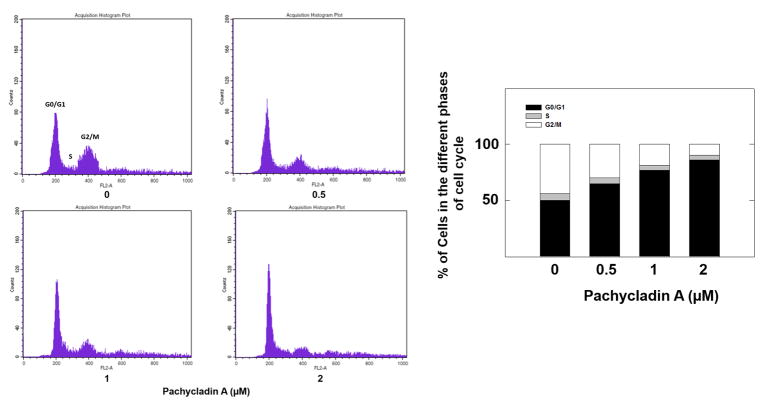
Fig. 6.
Flow cytometry and cell cycle progression in control and pachycladin A-treated MDA-MB- 231 cells. Left panel shows histograms generated using CellQuest software (PI staining). Right panel shows percentage of cells in each phase of cell cycle. Vertical bars show the average of three independent experiments.

