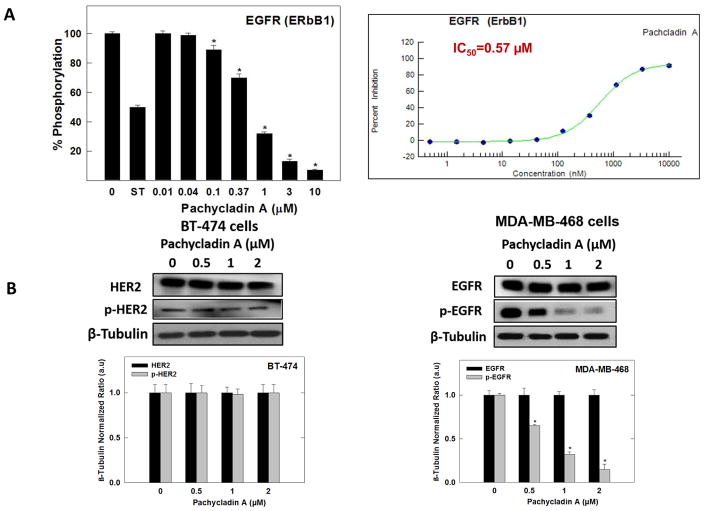
Fig. 9.
(A) Left panel; Effect of various doses of 1 on the phosphorylation (activation) of wild-type recombinant human EGFR kinase, using the Z’-LYTE™ assay kit. Error bars indicate the S.D. of n = 3/dose; staurosporine was used as a standard positive control at 0.1 μM. Right panel; The complete 10-point dose-response curve of 1 in inhibiting the phosphorylation (activation) of wild-type recombinant human EGFR kinase using the Z’-LYTE™ assay kit and its IC50 shown in red. (B) Left panel; Western blot analysis showing pachycladin A did not have any significant effects on HER2 signaling after 48 h treatment in human BT-474 breast cancer cells. Right panel; Western blot analysis showing pachycladin A treatment caused a dose-dependent inhibition of EGFR phosphorylation without any effect on its total levels, compared to vehicle-treated control group in MDA-MB-468 cells. Scanning densitometric analysis was performed on all blots conducted in triplicate and the integrated optical density of each band was normalized with corresponding β-tubulin, as shown in bar graphs below their respective Western blot images. Vertical bars in the graph indicate the normalized integrated optical density of bands visualized in each lane ± S.D.

