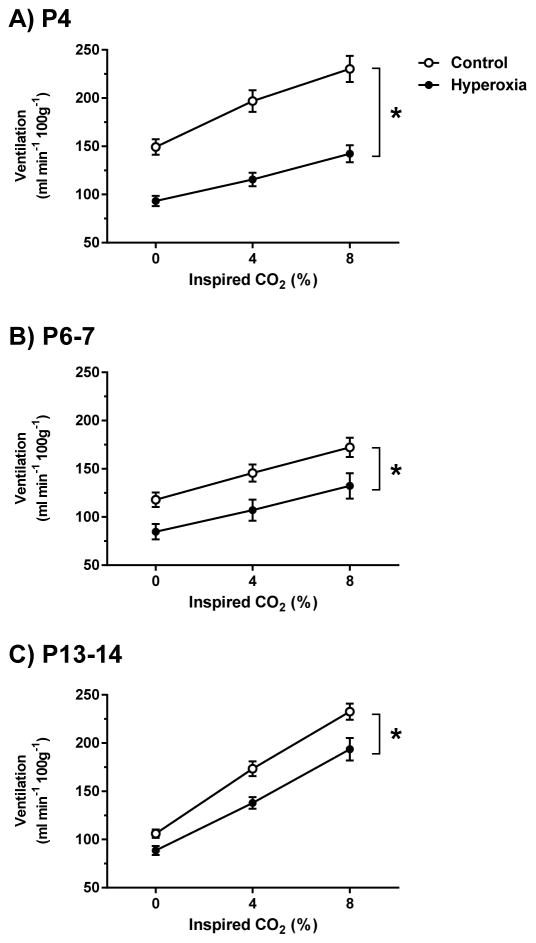
Fig. 7.
Minute ventilation during exposure to 0% (baseline), 4%, and 8% CO2 for (A) P4, (B) P6-7, and (C) P13-14 neonatal rats reared in 21% O2 (Control) or 60% O2 (Hyperoxia) from birth. Ventilation was measured at the end of the 5-min exposures to 4% and 8% CO2. Values are mean±SEM. Number of observations (Control, Hyperoxia): P4 (n=20, 19), P6-7 (n=17, 16), P13-14 (n=18, 15). * P<0.05 vs. Control at all time points (i.e., main effect for developmental treatment). Although not shown on the graph for clarity, ventilation increased significantly with increasing inspired CO2 level at all ages (i.e., 4% vs. 0% CO2 and 8% vs. 4% CO2, all P<0.001).

