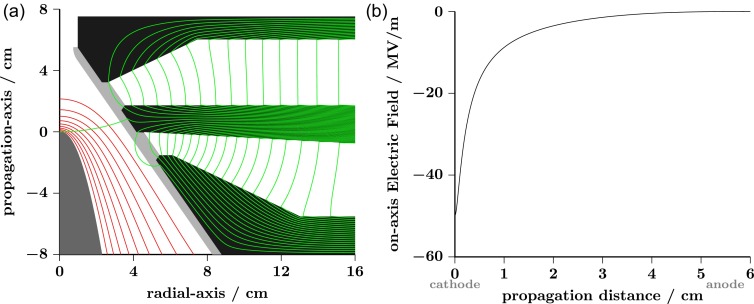
FIG. 2.
(a) Schematic of the electron source concept. Equipotential and magnetic field lines are shown in red and green, respectively. (b) Electric field values obtained along the centrosymmetric axis (0, 0, z) for a cathode held at 300 kV. Calculations were done using Poisson Superfish.82

