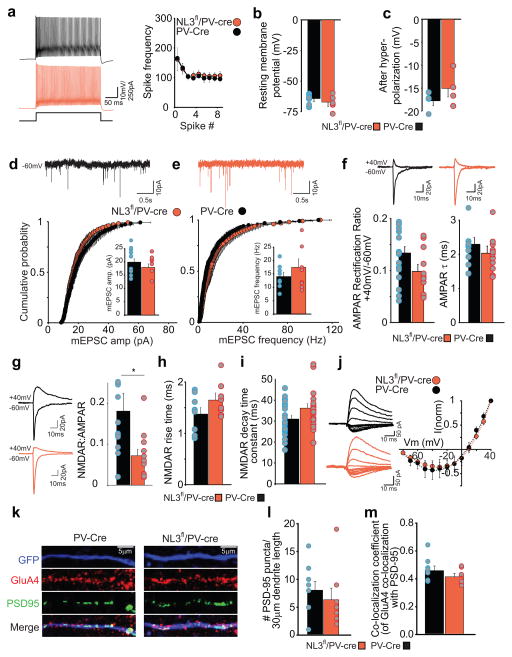
Figure 1.
NL3 deletion reduces NMDA receptor-mediated EPSCs in hippocampal PV interneurons. (a) Firing properties of CA1 PV interneurons in wild type PV-Cre and NL3fl/PV-Cre mice. Sample traces in response to twice threshold current injection (left). Spike frequency as a function of spike number (right) is unchanged by NL3 deletion (Frequency at spikes 4–8: PV-Cre, 111 ± 10 Hz, n=6 cells; NL3fl/PV-Cre, 115 ± 10 Hz, n=6 cells). (b) Resting membrane potential of PV interneurons is unchanged by NL3 deletion (PV-Cre, −64 ± 2 mV, n=6 cells; NL3fl/PV-Cre, −67 ± 3 mV, n=6 cells). (c) Amplitude of fast afterhyperpolarizing potential is unchanged by NL3 deletion (PV-Cre, 18 ± 1 mV, n=4 cells; NL3fl/PV-Cre, 15± 2 mV, n=4 cells). (d–e) (top) sample traces showing mEPSCs. (bottom) cumulative distribution plot for AMPAR mEPSC amplitudes (d) and frequency (e) showing no change due to NL3 deletion (p > 0.05, KS test for both amplitude and frequency). Inset shows average mEPSC amplitudes (d) (PV-Cre, 21 ± 2 pA, n=9 cells; NL3fl/PV-Cre, 19 ± 2 pA, n= 8 cells; p > 0.05) and mEPSC frequency (e) (PV-Cre, 14 ± 2 Hz, n = 9 cells; NL3fl/PV-Cre, 17 ± 3 Hz, n= 8 cells; p> 0.05). (f) (top) sample average traces showing evoked AMPAR EPSCs at −70 and +40 mV. (bottom) rectification ratio (left) measured as a ratio of peak AMPAR current at +40 mV and −60 mV is unchanged by NL3 deletion (PV-Cre, 0.13 ± 0.1, n = 19 cells; NL3fl/PV-Cre, 0.09 ± 0.02, n= 11 cells; p> 0.05). AMPAR EPSC decay kinetics (right) fitted with a single exponential fit are unchanged by NL3 deletion (PV-Cre, 2.3 ± 0.2, n = 12 cells; NL3fl/PV-Cre, 2.0 ± 0.2, n= 11 cells; p> 0.05). (g) Representative traces of AMPAR EPSCs recorded at −60 mV and dual component EPSC at +40 mV (left). NMDAR/AMPAR ratio (right) is reduced by NL3 deletion (PV-Cre, 0.18 ± 0.1, n = 12 cells; NL3fl/PV-Cre, 0.07 ± 0.1, n = 12 cells; p < 0.05). (h) NMDAR EPSC rise time is unchanged by NL3 deletion (NL3fl/PV-Cre, 1.37 ± 0.10 ms, n = 8 cells; PV-Cre, 1.64 ± 0.15 ms, n = 10 cells; p>0.05). (i) Weighted decay time constants for NMDAR EPSCs are unchanged by NL3 deletion (NL3fl/PV-Cre, 31.0 ± 1.8 ms, n = 20 cells; PV-Cre, 36.2 ± 2.1 ms, n = 22 cells; p>0.05). (j) I–V relationship of NMDAR EPSCs is unchanged by NL3 deletion. k, Representative images from dendrites (30 μm) of hippocampal PV-Cre (left) and NL3fl/PV-Cre neurons infected with AAV-DIO-GFP and immunolabeled for GFP (top), GluA4, PSD-95 (middle) with merged images (bottom). l, Bar graph quantifying the number of PSD-95 puncta per 30 μm of the dendrite (PV-Cre 8.2 ± 1.5, n = 9; NL3fl/PV-Cre, 6.5 ± 1.9, n = 8; p > 0.1). m, Bar graph showing the co-localization of GluA4 and PSD-95 puncta (Co-localization coefficient in PV-Cre 0.46 ± 0.02, n = 9; NL3fl/PV-Cre, 0.42 ± 0.02, n = 8; p > 0.1).

