Fig. 1.

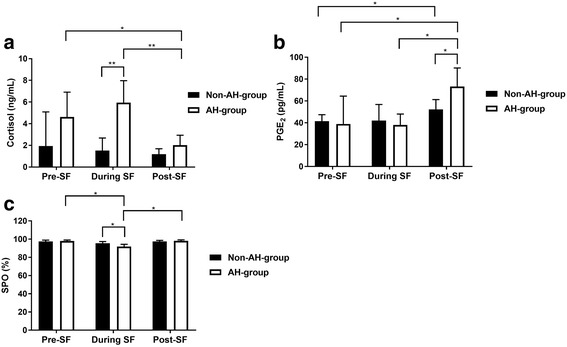
Between and within group comparisons for cortisol (a), PGE2 (b) and SPO (c). SF: Simulated flight. Bars indicate SD. *: p < 0.05. **: p < 0.001

Between and within group comparisons for cortisol (a), PGE2 (b) and SPO (c). SF: Simulated flight. Bars indicate SD. *: p < 0.05. **: p < 0.001