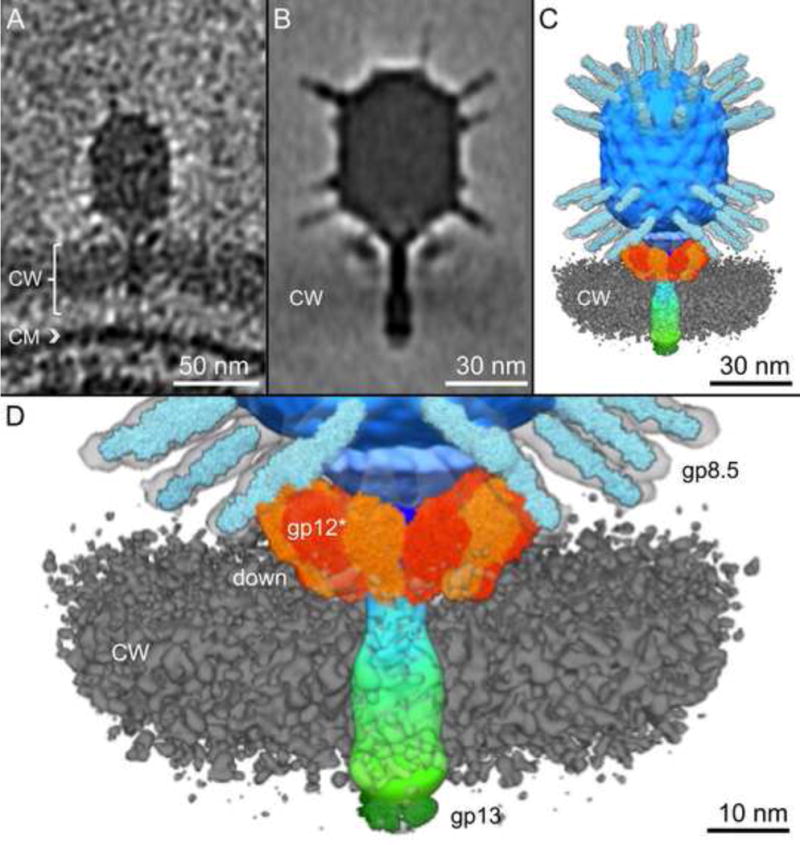
Figure 5. Visualization of Φ29 penetrating the cell wall.

A) A slice through a tomographic reconstruction of a phage particle penetrating the cell wall (CW) perpendicular to the cytoplasmic membrane (CM). B) Density map of adsorbed Φ29 as determined by subtomogram averaging. C) Surface rendering of the adsorbed Φ29 embedded in the cell wall (colored in grey). Crystal structures for the gp8.5 head fibers (Xiang and Rossmann, 2011), gp12 appendages (Xiang et al., 2009) and gp13 tail tip protein (Xiang et al., 2008) have been manually docked into the map. D) Close up surface rendering of appendages in the down position. The cell wall (CW) has been made transparent to allow visualization of the tail knob. Head fibers are shown in light blue, the capsid in darker blue, appendages in light and dark orange, and the tail is shown as a gradient from blue to green, terminating with the tail knob.
