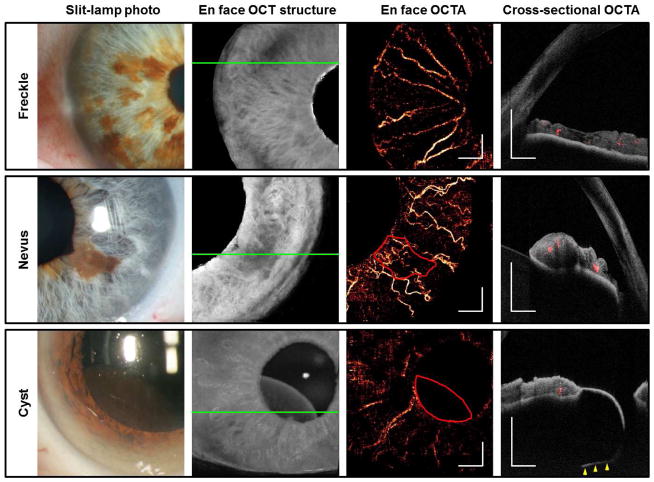
Figure 2.
Benign iris lesions imaged by the by the 1050 nm OCT. Green solid lines indicate the locations of the cross-sectional OCTAs. The areas of the nevus and cyst were outlined in red. White scale bars are 1 mm in length. Cross-sectional OCTAs show blood flow signal in red and reflectance of static pixels in gray scale. The posterior boundary of the iris pigment epithelial cyst (yellow arrowheads) was within the OCTA scan volume. The iris thickness was up to 0.50 mm at the freckles and 0.76 mm at the nevus. The cyst thickness was up to 1.43 mm.

