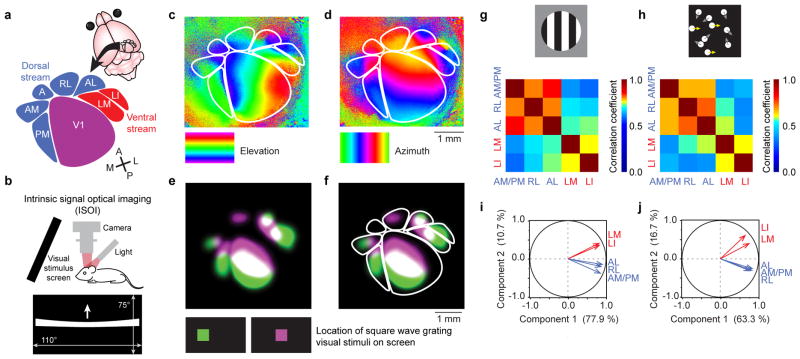
Figure 1. Mapping and functional grouping of putative dorsal and ventral stream higher visual areas (HVAs) in mice.
(a) Schematic view of the cortical location of V1 and HVAs in the right hemisphere, assigned to putative dorsal and ventral streams following the work of Burkhalter, Wang, and colleagues2,3. (b) Intrinsic optical signals were measured as decreases in the reflectance of red (700 nm) light as cortical regions were activated, measured using a tandem lens macroscope and a CCD camera. The visual stimulus monitor was tilted towards the mouse, and covered 110° of horizontal, and 75° of vertical visual field. The mouse was centered in front of the monitor, with its nose pointed towards the right side, to maximize coverage of the left visual hemifield. To map retinotopy, a single white bar drifted across the screen (horizontal or vertical, warped to ensure isoelevation and isoazimuth activation patterns). (c) Elevation and (d) azimuth maps revealed the meridians of retinotopy that form the borders among visual cortical areas. Cortex is color-coded according to the location of the bar on the monitor at the time of the evoked visual response. The locations of HVAs were drawn based on these retinotopic maps for each mouse individually. Rigid templates were not used. (e) To further confirm the location of HVAs, gratings were displayed in small square apertures, and the resulting activation pattern was used to locate retinotopically active areas in V1 and HVAs. Two maps were generated, each with the aperture in a different azimuthal location on the monitor (color-coded green and violet). (f) The spatial relationship between the two evoked maps matched the predictions from the (c) elevation and (d) azimuth retinotopic maps. (g,h) Maps evoked by stimulation with gratings (g) or kinematograms (h) both exhibited responses that were significantly correlated among dorsal stream HVAs, and among ventral stream HVAs, but less correlated between the two streams. (i,j) Principal component analysis (22-dimensional vectors for n = 22 mice), carried out independently for maps from (i) gratings and (j) kinematograms, indicated that dorsal and ventral stream HVAs exhibit correlated variability. These analyses provide functional evidence that AL, RL, and AM/PM belong to one subnetwork, and LM and LI belong to another. Correlation values and statistics are shown in Supplementary Table 1.

