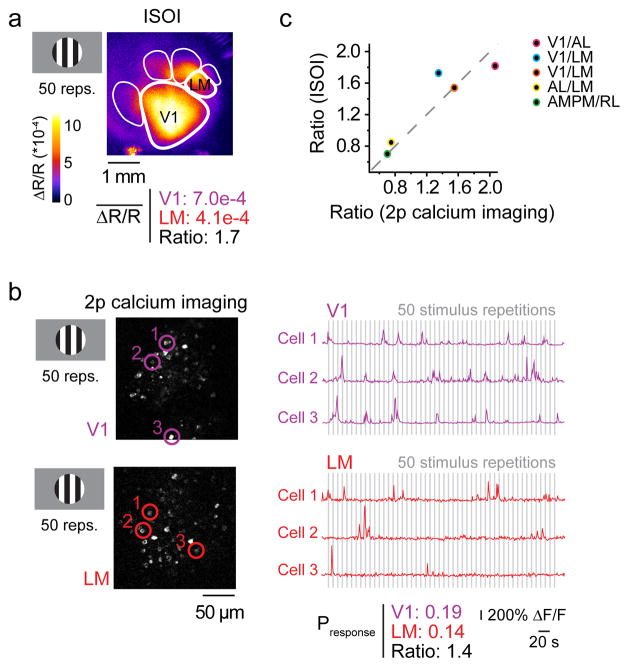
Figure 3. Visually evoked responses measured as ISOI signals correlate with action potential-associated calcium signals.
To validate the quantitative measurements from ISOI signals, visually evoked cortical activity was measured in the same mice using both ISOI and 2-photon (2p) calcium imaging. (a) A square wave grating stimulus (drifting for 2 s, stationary for 6 s) evoked activity in V1 and HVAs, and the average change in reflectance (ΔR/R) over 50 repetitions was recorded via ISOI. (b) Population activity, with single neuron resolution, was measured using 2p calcium imaging of neurons. Example images show V1 and LM neurons expressing GCaMP6s. The same visual stimulus was used. Example traces show responses from 6 neurons (circled and color coded in the images on the left) to 50 repetitions of the stimulus used to measure the average probability of response to the stimulus in V1 and LM (grey bars indicate the 2 seconds during which the grating drifted). (c) The ratios of responsiveness between two cortical areas were the same whether measured with ISOI or 2p calcium imaging (n = 10 cortical areas, 5 intra-mouse comparisons, 3 mice; Pearson’s R = 0.92; P = 0.027). Data from panels (a) and (b) are represented by the blue data point. The other colored points represent different pairs of cortical areas as indicated in the inset. Thus, ISOI provides a faithful report of evoked activity in V1 and HVAs simultaneously.

