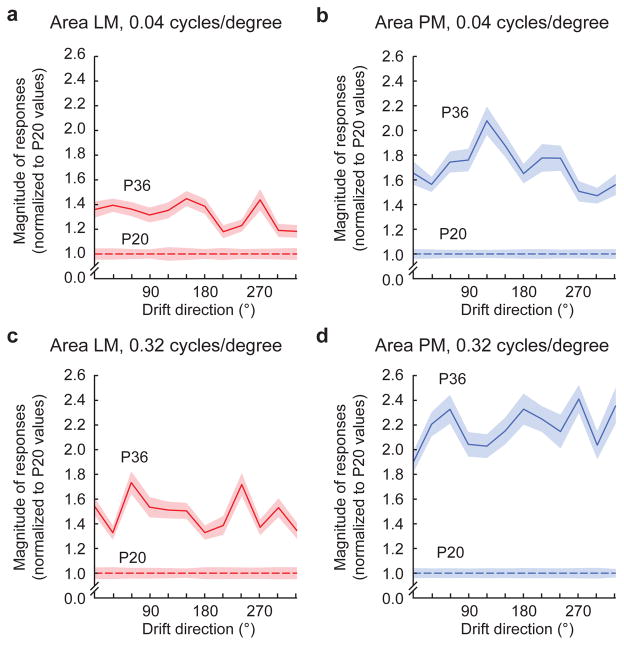
Figure 4. Response magnitude increases in areas PM and LM from P20 to P36 measure with 2p calcium imaging.
(a) With 0.04 cycle/degree gratings, response magnitudes to oriented gratings in area LM increased from P20 to P36, (b) while a larger increase occurred for neurons in area PM. (c,d) With 0.32 cycle/degree gratings, response magnitudes increased for both LM and PM from P20 to P36. Again, the relative increase for area PM was larger than the increase for neurons in area LM. Shaded regions indicate SEM.

