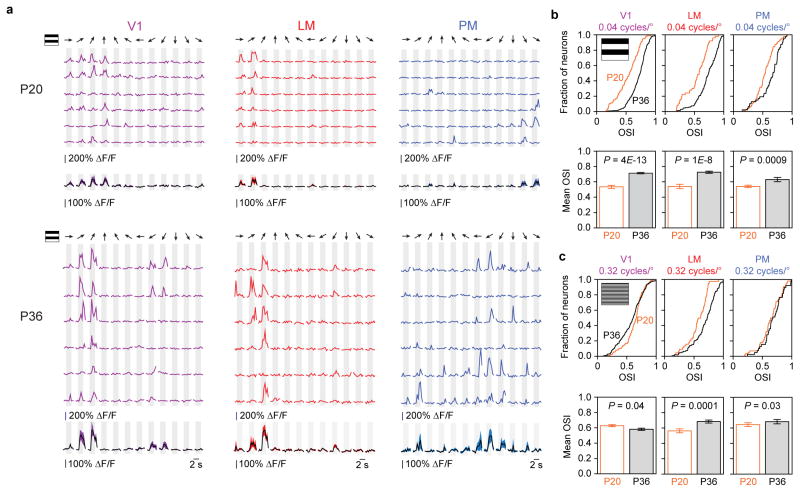
Figure 5. Orientation tuning changes in areas V1, LM, and PM from P20 to P36.
(a) Data from six different example cells in areas V1, LM, and PM in P20 and P36 mice. Single sweeps (top) and mean +/− SEM (bottom) show orientation tuned responses (12 directions). (b) Population data for orientation tuning in areas V1, LM, and PM at P20 and P36 for 0.04 cycles/degree and (c) 0.32 cycles/degree gratings. Both cumulative histograms (top rows of b,c) and bar graphs (bottom rows of b,c; mean ± SEM) are shown for each data set.

