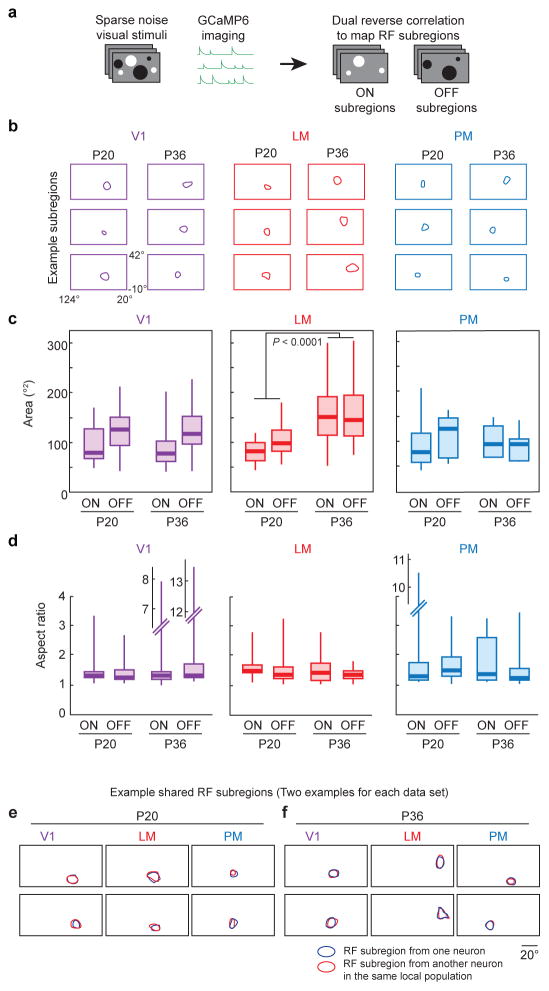
Figure 6. Receptive field subregion changes in areas V1, LM, and PM from P20 to P36.
(a) RF subregions were mapped using sparse noise visual stimulation. Reverse correlation was used with the white and black dots separately to independently recover the ON and OFF RF subregions. (b) Example RF subregions for areas V1, LM, and PM at ages P20 and P36. (c) Both ON and OFF subregions increased in size in area LM between P20 and P36. Similar increases were not detected in areas V1 or PM. (d) Aspect ratios of RF subregions did not significantly change between P20 and P36. (e) Shared RF subregions were observed in areas V1, LM, and PM at both P20, and (f) P36. Each box plot in (c,d) indicates the median (thick line), the range of the middle two quartiles (shaded boxes), and the full data range (whiskers).

