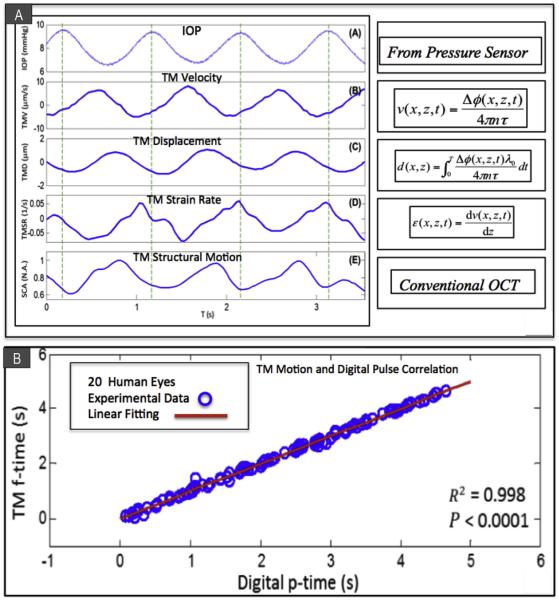
Fig. 9.
(A) Ex vivo PhS-OCT whole eye experiments. Temporal plots over 3.5 s of IOP measurements provided by an in-line pressure transducer synchronized with PhS-OCT system. (inset (A)) IOP; (inset (B)) trabecular meshwork velocity (TMV); (inset (C)) trabecular meshwork displacement (TMD); (Inset(D)) trabecular meshwork strain rate (TMSR) and (inset (E)) normalized SC size (SCA). The experimental conditions were mean IOP 8 mmHg, pulse amplitude 3 mmHg and 1 pulse/second. The dashed vertical lines indicate the time of the IOP pulse peaks. (B) In vivo PhS-OCT in human subjects. Arrival times of human digital pulse vs. TM motion peak. A significant correlation (R2 = 0.998, P < 0.0001) of the instantaneous time between the digital pulse peaks [digital p-time, marked by black thin arrows in Fig. 3(D)] and the TM pulse minima [TM f-time, marked by blue bold arrows in Fig. 3(D)] is found. The results demonstrate the temporal synchronization between the cardiac pulse and the TM motion. (A) from: Li P, Reif R, Zhi Z et al. Phase-sensitive optical coherence tomography characterization of pulse-induced trabecular meshwork displacement in ex vivo nonhuman primate eyes. J Biomed Opt. 2012; 17:076026. (B) from: Li P, Shen TT, Johnstone M, Wang RK. Pulsatile motion of the trabecular meshwork in healthy human subjects quantified by phase-sensitive optical coherence tomography. Biomed Opt Express. 2013; 4:2051–2065. (For interpretation of the references to colour in this figure legend, the reader is referred to the web version of this article.)

