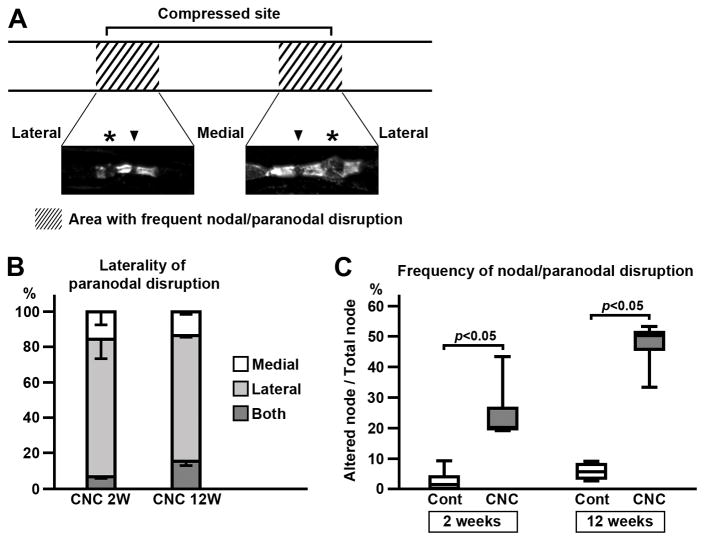
FIGURE 4.
Distribution of paranodal disruption in compressed nerves. (A) Altered paranodes or nodes were frequently observed in the area near both edges of compressed site and in a short segment outside of the tubing (shaded areas). Representative images of Caspr immunostaining in the compressed nerve (2 weeks) are shown. Paranode on lateral side (far from the center of compressed site) is more frequently disrupted (asterisks) than the medial side (close to the center of compressed site). Arrowheads indicate nodes. (B) Laterality of paranodal disruption. One NF cluster with Caspr and Kv1.2 staining on both sides is counted as 1 node. At both 2 weeks (4 mice) and 12 weeks (4 mice), nodes with disrupted paranodes on lateral sides are predominant. Mean and standard deviation (error bars in the boxes) are shown. (C) Frequency of paranodal and nodal disruption at the area where the abnormalities are most abundant (shaded area in panel A). One NF cluster with Caspr and Kv1.2 staining on both sides is counted as 1 node. Node is considered to be altered when 1 or more of these clusters were disrupted. Data were obtained from 4 mice at 2 weeks and 4 mice at 12 weeks.

