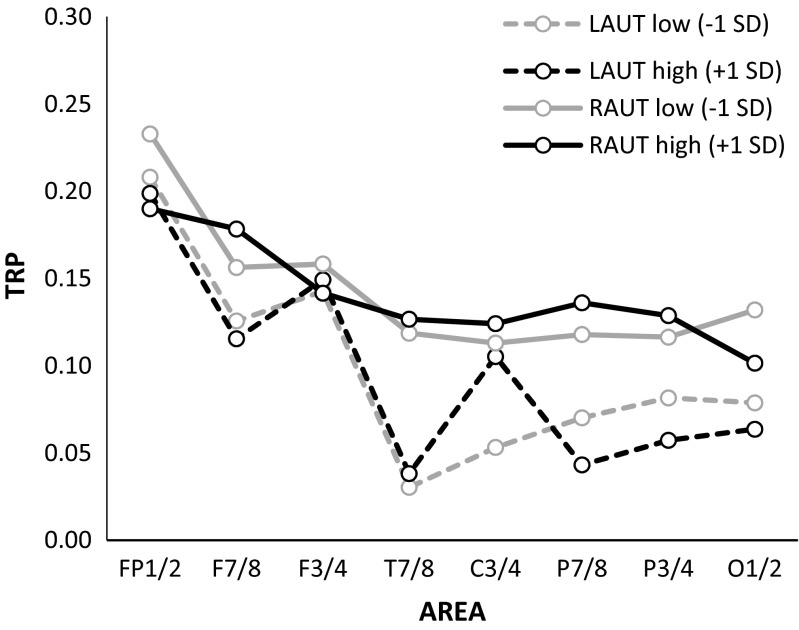
Fig. 4.
Task-related changes in alpha power (TRP) during performance of the Alternative Uses Test (AUT) as a function of task performance (AUT fluency). Positive TRP values indicate increases in alpha power from the reference to the activation period. Predicted TRPs (calculated using standard regression analysis) are plotted separately for each cortical position of the left (L) and the right (R) hemisphere for AUT performance changes one SD below (AUT low, dark gray lines) and one SD above (AUT high, black lines) the mean

