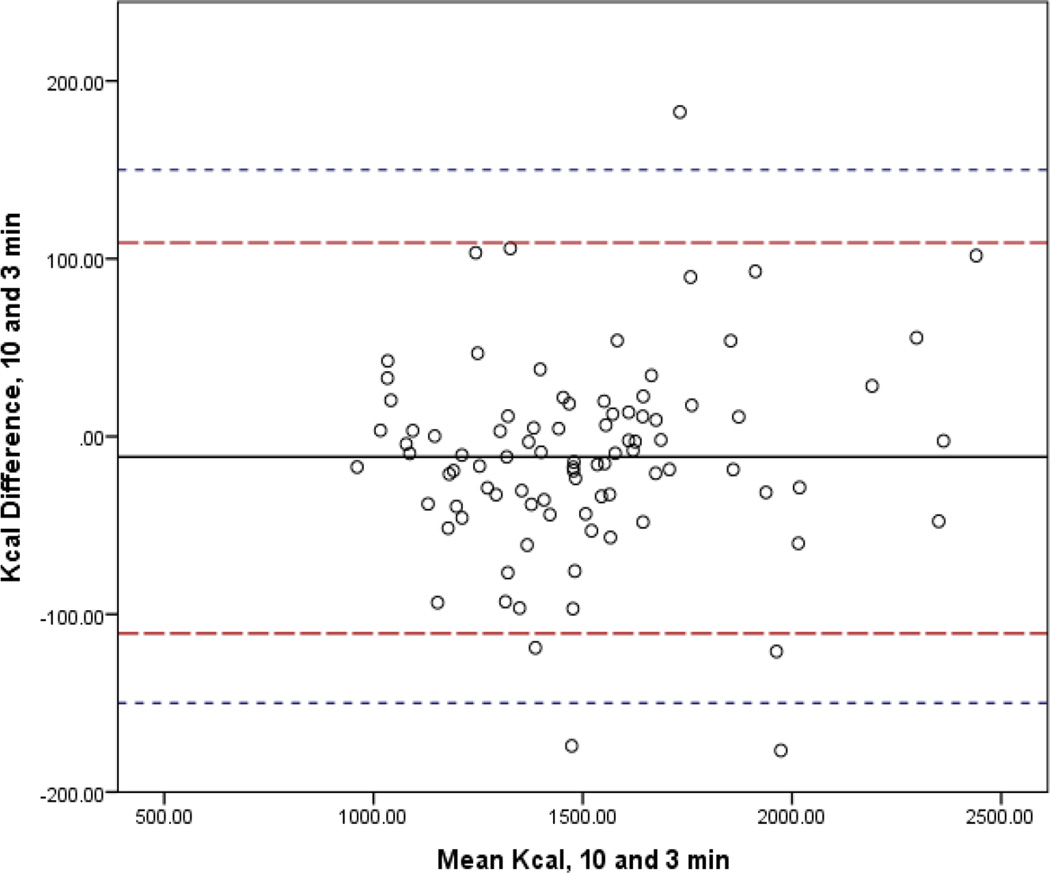
Figure 3.
Bland-Altman Analysis Comparing mREE of the Standard Reference of 10 minutes to 3 Minute Abbreviated Steady State Interval.
Legend: The mean bias is represented by the solid line and 95% CI by the long dashed lines. Lines very close to zero on the Y axis indicate low bias. The short dashed line indicates the reference period (10-min) within 10% band of agreement (±150.3).

