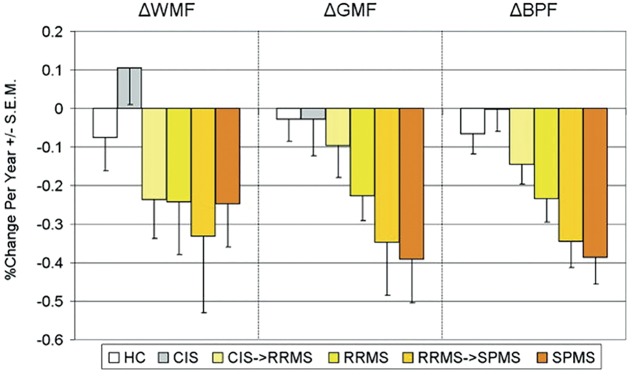
Figure 3. Longitudinal changes in gray matter (GM) and white matter (WM) atrophy in multiple sclerosis (MS) phenotypes.
Plot of the mean annualized rates of change for WM fraction (WMF), GM fraction (GMF), and brain parenchymal fraction (BPF) in patients with MS with different disease clinical phenotypes, including healthy controls (HCs; white bars; n = 17), patients with clinically isolated syndromes (CIS; gray bars) throughout the 4‐year study (n = 7), patients who started the study with a diagnosis of CIS and converted to relapsing‐remitting MS (CIS→RRMS; light yellow bars; n = 8), patients with RRMS throughout the study (RRMS; dark yellow bars; n = 28), patients who started the study with a diagnosis of RRMS and progressed to secondary progressive MS (RRMS→SPMS; light orange bars; n = 7), and patients with SPMS (orange bars) throughout the study (n = 19). Error bars indicate SEM. From Fisher E, Lee JC, Nakamura K, Rudick RA. Gray matter atrophy in multiple sclerosis: a longitudinal study. Ann Neurol 2008;64:255–265,4 by permission of Wiley-Liss, Inc., © 2008 American Neurological Association.

