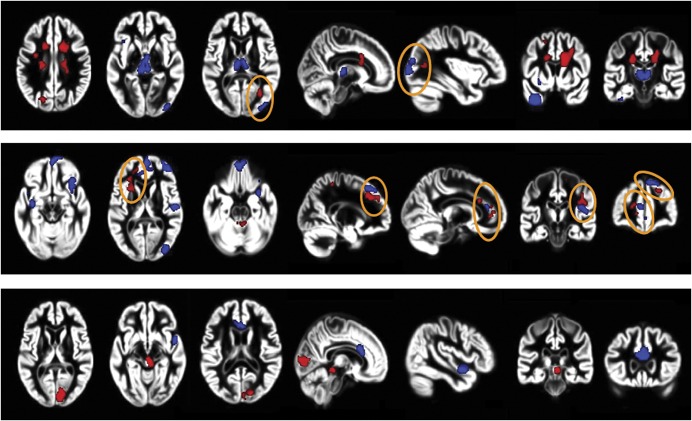
Figure 4. T2 lesions, gray matter (GM) atrophy, and cognitive impairment in multiple sclerosis (MS).
Distribution of regions of significant GM atrophy (blue) and T2‐visible lesions (red) in cognitively impaired vs cognitively preserved patients with MS according to the clinical phenotype. Top row: relapsing-remitting MS; middle row: secondary progressive MS; bottom row: primary progressive MS. Orange circles identify regions with a correspondence between presence of T2-visible lesions and GM atrophy. Images are oriented with neurologic convention. From Riccitelli G, Rocca MA, Pagani E, et al. Cognitive impairment in multiple sclerosis is associated to different patterns of gray matter atrophy according to clinical phenotype. Hum Brain Mapp 2011;32:1535–1543,39 by permission of Wiley-Liss, Inc., © 2010.

