Fig. 4.

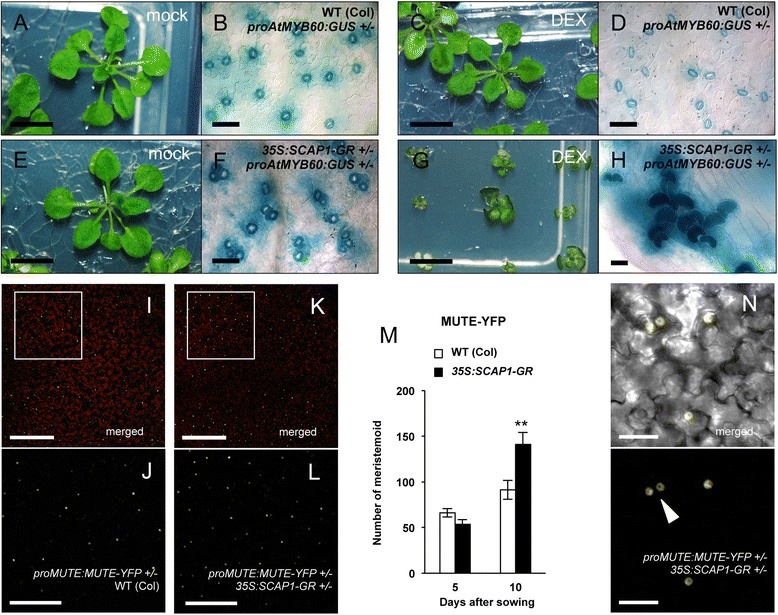
SCAP1 affect stomata spacing and induce meristemoid production. a-d Morphological alterations observed in 4-weeks old wild type (Col) or (e-h) pro35S:SCAP1-GR (35S:SCAP1-GR) plants grown in presence of DEX (c-d and g-h) or mock (a-b and e-f). f, h GUS staining of double proAtMYB60:GUS pro35S:SCAP1-GR or (B, D) single proAtMYB60:GUS hemizygous plants. i-j Confocal images of MUTE-YFP fusion proteins in hemizygous proMUTE:MUTE-YFP or (k-l and n) double hemizygous proMUTE:MUTE-YFP pro35S:SCAP1-GR transgenic plants. Insets (j and l) are higher magnification of the areas shown in (i) and (k), respectively. White arrowhead in (n) indicates two adjacent meristemoid. m Number of epidermal cells accumulating MUTE-YFP protein in hemizygous proMUTE:MUTE-YFP or double hemizygous proMUTE:MUTE-YFP pro35S:SCAP1-GR plants at different developmental stages (5 and 10 das). Shown is the average number of observable nuclei expressing MUTE-YFP in epidermal cells of 10 independent 1st leaf primordia. Note that at stage 5 das, numbers refer to the entire primordium while at 10 das numbers refer to an area of 562 mm2. Error bars = Standard Error. ** = P < 0.01 two tails T Student test. Bars = 1 mm (a, c, e, g,); 200 μm (i, l); 100 μm (j, m); 50 μm (b, d, f); 20 μm (h, o)
